Why Silver Price Jumped to $82 Today: Iran, Oil and the Fed
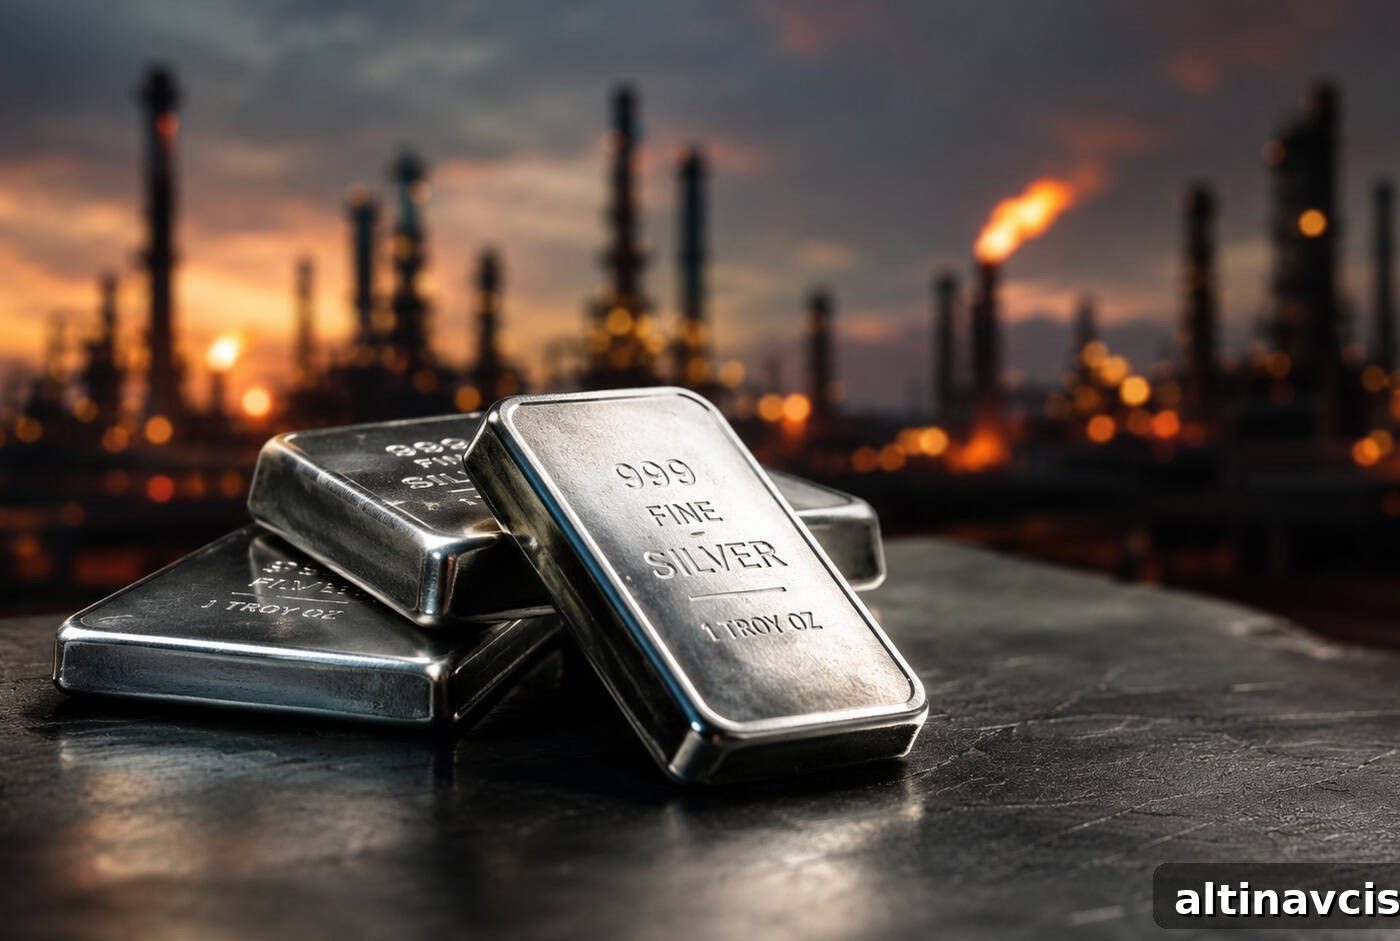
Gold and silver market update — May 7, 2026
Key Takeaways
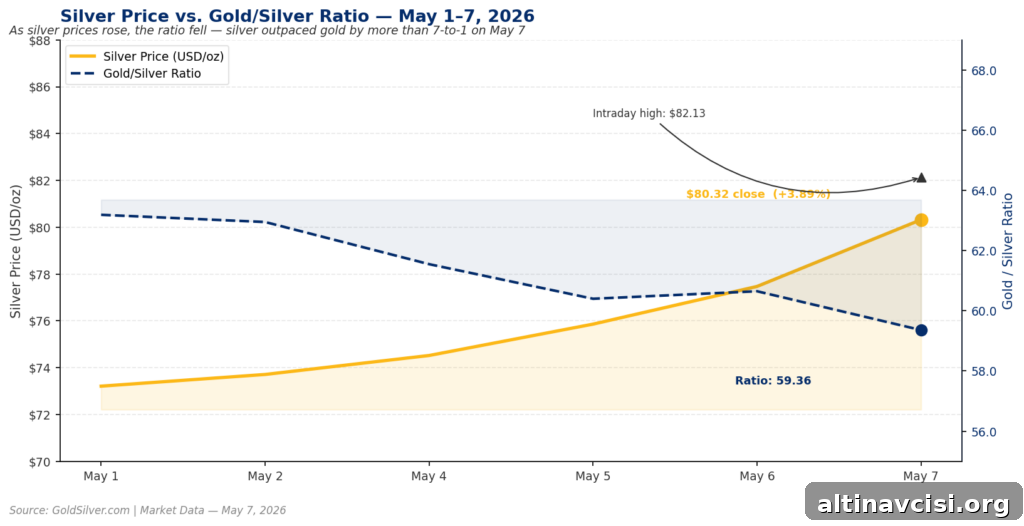
- On May 7, 2026, silver reached an intraday high of $82.13 and closed at $80.32, up 3.89%. The move followed reports of a possible U.S.–Iran memorandum of understanding that pushed oil prices lower, which in turn reduced near-term inflation expectations and improved the outlook for Federal Reserve rate cuts.
- The gold/silver ratio compressed to 59.36 from 60.65, reflecting silver’s strong outperformance versus gold on the session. Because roughly 60% of silver demand is industrial, any reopening of the Strait of Hormuz or related improvement in trade flows would disproportionately benefit silver’s industrial side.
- The bear case remains relevant: Iran has not confirmed any agreement, the Chicago Fed president warned that inflation has accelerated since the conflict began, and silver has already posted very large gains year-over-year — many bullish expectations are likely priced in.
Why Did Silver Spike to $82 on May 7, 2026?
The jump in silver on May 7, 2026 was driven largely by macro news rather than anything specific to the silver market. Reports that the U.S. and Iran were close to a one-page, 14-point memorandum of understanding — a proposed framework to declare an end to hostilities and open a 30-day window for discussions about the Strait of Hormuz and nuclear talks — sent oil prices lower. That drop in energy prices relaxed immediate inflation pressures and strengthened the narrative for eventual Federal Reserve rate reductions, which boosted precious metals across the board, with silver leading the move.
It is important to note that these reports were not a formal confirmation: Iran had not publicly validated the memo and no final agreement was announced. Nonetheless, markets reacted quickly to the possibility of reduced geopolitical risk and cheaper energy, and silver’s price reflected that shift in expectations.
The Edge Every Investor Needs
Smarter precious metals investing starts here. The Nuggets Newsletter delivers concise market insights, Fed updates, global trends, and educational material to help you follow gold and silver more confidently.
How Does Falling Oil Push Silver and Gold Higher?
Falling oil prices influence precious metals primarily through expectations for inflation and monetary policy. Lower energy costs help reduce headline inflation, which gives central banks more room to lower interest rates. When nominal rates fall or when inflation expectations rise relative to nominal yields, real yields decline. Lower real yields reduce the opportunity cost of holding non-yielding assets like gold and silver, making them more attractive as stores of value. That channel explains why a drop in oil after a peace signal can quickly boost demand for both metals.
The reverse also applied earlier in the year: when the conflict around the Strait of Hormuz pushed oil higher, inflation expectations stayed elevated, delaying prospects for rate cuts and placing selling pressure on precious metals. A single session of falling oil does not erase months of higher energy-driven inflation, but it can change market expectations in the short term and trigger sharp moves in metal prices.
Officials’ comments matter in this context. Federal Reserve Bank of Chicago President Austan Goolsbee warned that inflation has not moved decisively toward the Fed’s 2% objective and that it has accelerated since the conflict began. Those remarks underscore why markets treat geopolitical developments and recent inflation data as key inputs for metal prices.
What Is the Gold/Silver Ratio Telling Investors Right Now?
The gold/silver ratio indicates how many ounces of silver are required to buy one ounce of gold. A falling ratio means silver is outperforming gold. On May 7, 2026 the ratio compressed to about 59.36 from 60.65 the previous session, signaling that investors were pricing both a clearer path to Fed rate cuts and an improvement in silver’s industrial outlook at the same time.
Silver combines monetary and industrial demand in a way that gold does not. J.P. Morgan’s 2026 outlook estimated that roughly 60% of annual silver demand comes from industrial uses such as solar, electronics, and electric vehicles, with the remainder driven by investment and monetary demand. When a single development — for example, reduced geopolitical risk that eases energy costs — improves both the rate-cut outlook and industrial demand expectations, silver can outpace gold in both speed and magnitude.
Analysts’ full-year targets vary, but a confirmed reduction in geopolitical risk and a sustained decline in oil could push silver beyond recent levels. Conversely, if the peace narrative fails to materialize, silver’s monetary and safe-haven appeal could remain the stronger driver.
Does the Bear Case for Silver Still Hold After Today’s Rally?
Yes — both near-term and structural risks remain. In the short run, nothing about the memorandum of understanding was formally confirmed, and central bankers continue to caution that inflation risks persist. If the MOU proves inaccurate or the oil move reverses, the inflation-relief trade could unwind quickly and silver could fall back.
On a longer horizon, structural pressures — including large government financing needs and a complex macro backdrop — are not resolved by a single diplomatic development. The U.S. faces substantial borrowing requirements this year, and central bankers are managing a delicate balance between growth and inflation. These dynamics can support silver’s role as a monetary hedge even if industrial demand fluctuates.
In short, the rally highlights silver’s dual character: a confirmed easing of geopolitical risk and lower energy costs would boost its industrial outlook, while a failed deal or persistent macro stress would reinforce its appeal as monetary protection. That duality is why many investors consider silver a strategic, longer-term holding rather than only a short-term trade.
Stay On Top of Gold & Silver Prices
Get important market alerts sent straight to your inbox.
SOURCES
1. Trading Economics — Silver Price, Chart, Historical Data & News
2. nFusion Solutions — Precious Metals Spot Price API
3. FXStreet — Silver Price Today: Silver Rises on May 7, 2026
4. Axios — U.S. and Iran Closing in on One-Page Memo to End War, Officials Say
5. Bloomberg — Fed’s Goolsbee Sounds Warning on Inflation, Consumer Behavior
6. FXStreet — Fed’s Goolsbee: US‑Iran Conflict Is an Inflationary Shock
7. J.P. Morgan Global Research — How Will Silver Prices Fare in 2026?
8. Macrotrends — Gold to Silver Ratio: 100 Year Historical Chart
9. Fortune — Current Price of Silver, May 7, 2026
10. Fortune — Treasury Expected to Borrow $2 Trillion This Year to Continue Functioning
11. CNBC — Trump Fed Pick Kevin Warsh Clears Key Senate Hurdle, Teeing Up Final Vote
Disclaimer: This article is for informational purposes only and does not constitute financial or investment advice. Always consult a qualified financial adviser before making investment decisions.
You May Also Like:
- Gold Hits $4,746 as Oil Crashes. Here’s Why That’s Bullish
- Gold Price and Nonfarm Payrolls: Why the Fed Is Trapped
- Gold Is Decoupling From Geopolitics. Here’s the Proof
- The Fed Is Frozen. The Debt Is Growing. Gold Is Watching.
- Gold Jumps on Iran Deal Hopes. The Real Driver Is the Fed
- What the IMF’s Inflation Forecast Shift Means for Gold
- What’s Really Driving Gold Prices Today — 5 Key Signals
- Gold Price and the Jobs Report: A Pre-Market Guide
Popular Topics
Picked from the archive
-
01
 Topics
Bank Safety Deposit Box vs Gold Vault: Which Is Safer for Gold?
-
02
Topics
Gold Price Jumps Amid Fed Chair Uncertainty
-
03
Topics
Silver Prices Eye Record Highs as Fed Signals Rate Cuts
-
04
Topics
How Powell’s Press Conference Affects Gold Prices
-
05
Topics
How to Buy Silver Bars: Investor Guide to Price and Purity
-
06
Topics
Gold Drops as China Buys Most in 17 Months
-
07
Topics
Hormuz Crisis and Fed Policy: Markets Race to Gold and US Dollar
-
08
Topics
Is the U.S. Government Insolvent? What the Numbers Reveal