Gold Price Forecast: Oil Futures Diverge From Stocks
Gold and silver market update — May 8, 2026
Key Takeaways
- The World Gold Council’s April 2026 report is titled “The Return of Transitory,” referencing the 2021 inflation debate
- Equity markets largely view the Iran-Hormuz disruption as temporary; oil futures price in a prolonged shock — Brent December contracts trading roughly 22–25% above pre-crisis levels
- JPMorgan warns global oil stocks could reach an operational floor by September 2026 if the disruption continues
- COMEX managed-money positioning is neutral, leaving room for professional buyers to rebuild long exposure in gold
- Gold: $4,707.65 (+0.46%) | Silver: $80.50 (+2.71%) | Gold/Silver Ratio: 58.47 — snapshot as of 8:23 AM ET, May 8, 2026
When the Federal Reserve labeled rising consumer prices “transitory” in 2021, the term became shorthand for a major policy misread. By June 2022, U.S. consumer inflation peaked at 9.1%, triggering the Fed’s fastest tightening cycle in decades. That history frames how investors and institutions are interpreting current market signals — and it shapes the gold price outlook heading into summer 2026.
The World Gold Council’s April commentary, headlined “The Return of Transitory,” highlights a crucial divergence between risk assets and commodity markets: stocks have calmed and are treating the Hormuz shock as short-lived, while oil futures and many commercial hedgers are pricing a longer disruption. That split is a central driver for gold today.
Why Are Stock Markets and Oil Futures Telling Opposite Stories?
Equities have regained risk appetite after an initial spike in inflation breakevens when the Iran-Hormuz conflict intensified in late February. Many investors now expect a diplomatic resolution or a swift reopening of shipping lanes, which would relieve energy-driven inflation pressures and allow central banks breathing room.
Oil futures, however, are not pricing in a quick fix. The World Gold Council noted Brent crude December 2026 contracts trade at a 22–25% premium relative to levels before the Feb. 28 missile incidents. That premium reflects commercial hedgers, refiners, and airlines shifting to a downside-protection posture that assumes the disruption could last through year-end.
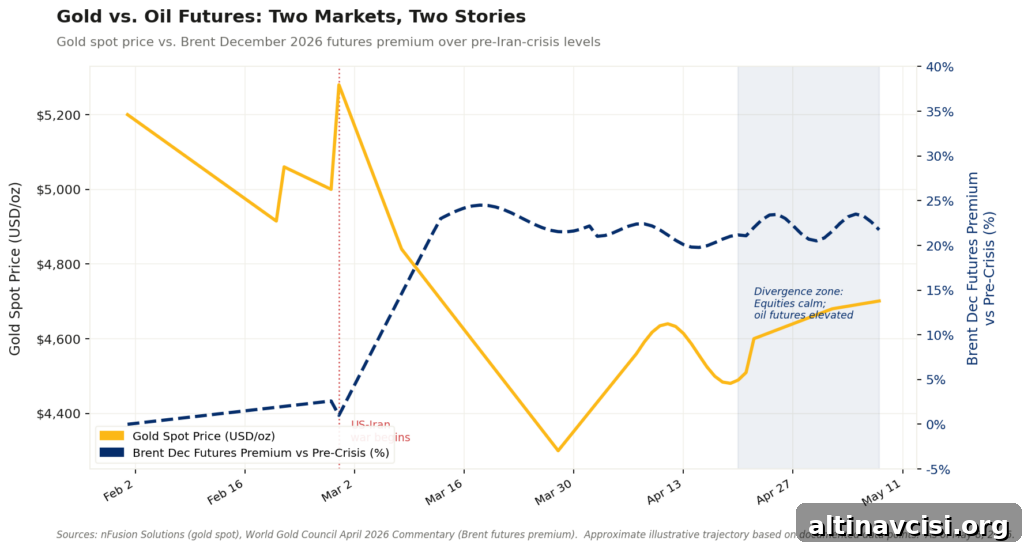
One of these markets will be proven wrong. That gap between expectations is where gold’s price action will likely concentrate in the coming months.
What Does This Divergence Mean for the Gold Price Outlook?
The near-term path for gold depends on which narrative wins.
If equity markets are right — the Hormuz corridor reopens, oil falls, inflation pressures ease — central banks will have room to cut or at least pause, compressing real yields. Under that scenario, institutional price forecasts such as Goldman Sachs’s $5,400 and JPMorgan’s $6,300 year-end estimates become achievable as inflation and real-rate dynamics favor higher nominal gold prices.
If oil futures prove prescient — supply disruption persists and prices stay elevated — inflation could remain sticky. JPMorgan’s commodity team warns that a prolonged closure could push global inventories to an operational floor by September 2026, increasing the risk of abrupt price moves and demand destruction. That outcome strengthens gold’s structural case as an inflation hedge and safe-haven asset.
Both scenarios are bullish for gold over a longer horizon, but they imply different price trajectories over the next six months. The market’s task is to price the probability and timing of each outcome.
What Is the WGC Actually Watching?
The World Gold Council is tracking three key signals:
- Macroeconomic surprise trends: growth data are weakening while inflation surprises have become more positive — a stagflationary mix that typically favors gold.
- Positioning: COMEX managed-money positioning was neutral at the end of April 2026, indicating professional speculators are not currently crowded long. That leaves meaningful scope for institutional buying without triggering a rapid unwind.
- Flows: European gold ETFs led global inflows in April. European investors often face greater direct energy exposure from Middle East disruptions, so their defensive buying is notable and suggests localized risk assessments differ from U.S. equity complacency.
In short, the crisis has reinforced many of the structural reasons to hold gold: uncertain inflation, fiscal strain, bond diversification limits, and gradual reserve diversification away from the dollar. These themes support a resilient gold price backdrop even if short-term volatility depends on which market narrative proves correct.
Gold and Silver Prices This Morning
Gold is $4,707.65 as of 8:23 AM ET, up 0.46%. Silver is $80.50, up 2.71%. The gold/silver ratio has tightened to 58.47 from 62.05 three days earlier.
Silver’s outperformance reflects its dual exposure: like gold, it benefits from lower real yields if inflation eases, but it also gains from restored industrial demand. If the Hormuz corridor reopens, silver sees both monetary and industrial demand reaccelerate, which can compress the gold/silver ratio quickly.
The Sound Money Read
When institutions previously labeled inflation “transitory,” owners of physical gold and silver who held through the period avoided costly timing mistakes. The World Gold Council is not predicting a repeat of that specific episode but cautions markets against assuming a large geopolitical and energy shock will resolve quickly and cleanly.
If oil markets’ longer-duration view is correct, gold’s structural drivers — inflation uncertainty, fiscal deficits, and constrained bond diversification — will reassert themselves and likely accelerate investor interest in precious metals.
Prices as of 8:23 AM ET, May 8, 2026.
SOURCES
1. U.S. Bureau of Labor Statistics — Consumer Price Index, June 2022: CPI up 9.1%
2. Federal Reserve — Powell Congressional Testimony, November 30, 2021 (retirement of the term “transitory”)
3. Federal Reserve Bank of Richmond — Analysis of the 2022 rate cycle
4. World Gold Council — Gold Market Commentary: The Return of Transitory, April/May 2026
5. J.P. Morgan Global Research — Commodity and gold price commentary 2026
6. Goldman Sachs research and public commentary on gold targets, 2026
7. Live spot price feeds and market data (gold and silver)
Disclaimer: This article is for informational purposes only and does not constitute financial or investment advice. Consult a qualified financial adviser before making investment decisions.
You May Also Like:
- Why Silver Hit $82 Today: Iran, Oil, and the Fed
- Gold Hits $4,746 as Oil Crashes — Why That’s Bullish
- Gold Price and Nonfarm Payrolls: Why the Fed Is Trapped
- Gold Is Decoupling From Geopolitics — Here’s the Proof
- The Fed Is Frozen. The Debt Is Growing. Gold Is Watching.
- Gold Jumps on Iran Deal Hopes — The Real Driver Is the Fed
- What the IMF’s Inflation Forecast Shift Means for Gold
- What’s Really Driving Gold Prices Today — 5 Key Signals
Popular Topics
Picked from the archive
-
01
 Topics
5 Factors That Drive Gold Spot Prices
-
02
Topics
Why the Fed Says Gold Will Stay Resilient
-
03
Topics
Gold, Silver Prices Hold Steady Ahead of Jackson Hole Summit
-
04
Topics
Gold Price Drops Below 50-Day Moving Average
-
05
Topics
Dollar’s 8% Slide Boosts Gold, Commodities and Global Assets
-
06
Topics
Gold Royalties Surge as Miners Struggle with Rising Costs
-
07
Topics
Gold Prices Jump Past $4,000 as Fed Signals Rate Cut
-
08
Topics
Why a Stalled Federal Reserve Matters for Gold Prices