Gold Price Drops Below 50-Day Moving Average
Gold Falls Below 50-Day Moving Average as Dollar Strengthens
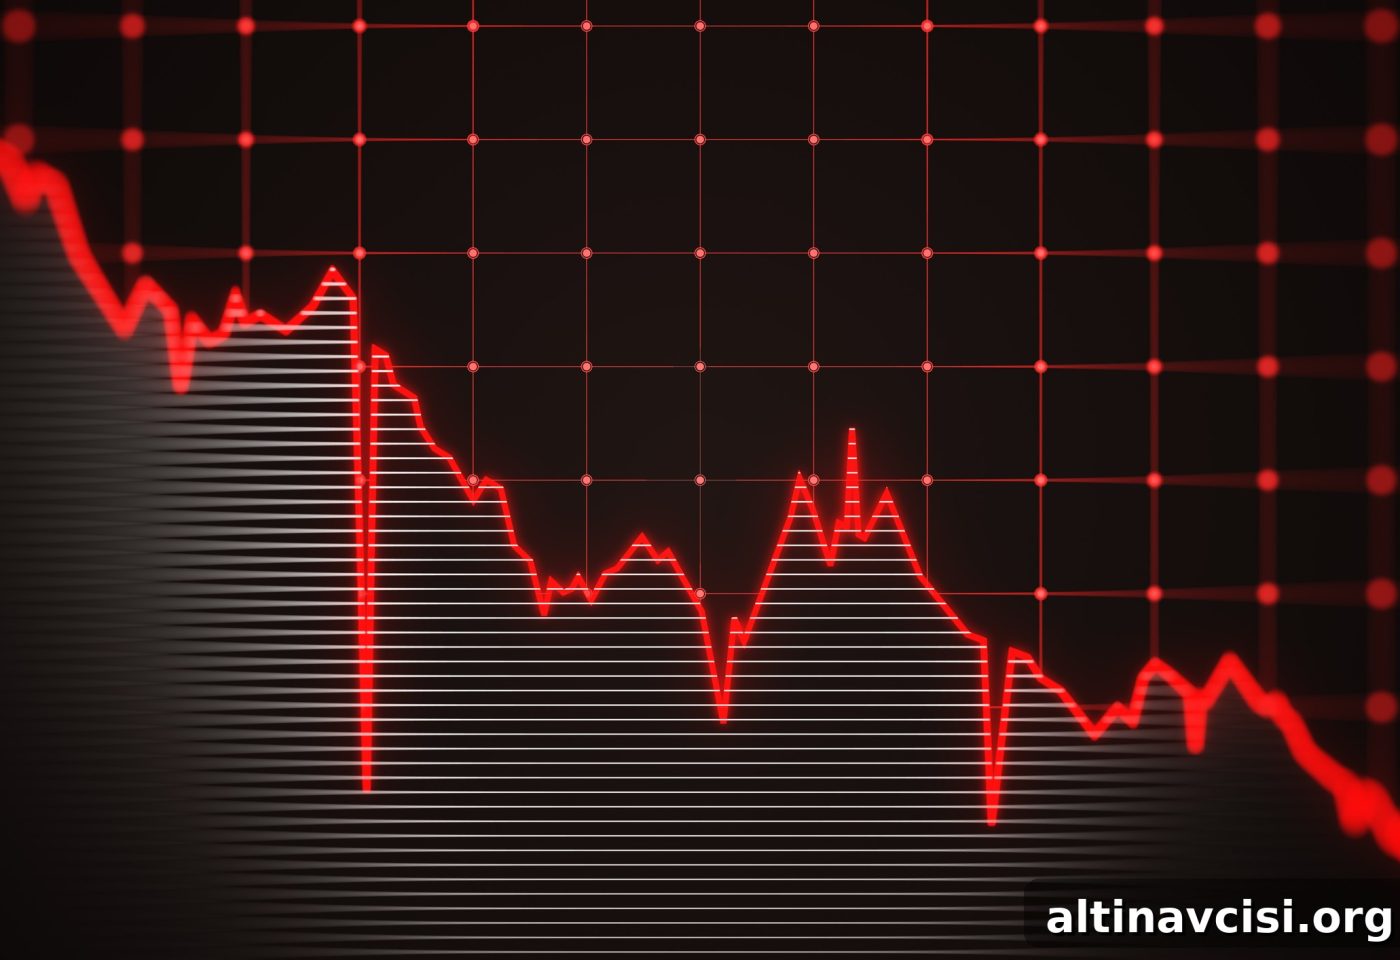
Gold closed Friday down nearly 1%, slipping beneath its 50-day simple moving average at $3,341 — a notable technical development that signals a short-term bearish tilt for the metal. The break of this commonly watched moving average ended a recent support level and shifts near-term downside focus to price zones around $3,310, $3,282, and $3,244.
Technical Picture: What the 50-Day Break Means
Traders and chart analysts often use the 50-day simple moving average (SMA) to gauge intermediate momentum. A decisive close below this line typically indicates that shorter-term momentum has turned negative and can invite selling from momentum strategies and short-term traders. The breach in this instance suggests that gold’s immediate bias favors downside testing of the next key support levels listed above.
That said, longer-term technicals remain an important counterbalance. The 200-day SMA, currently near $2,991, still offers a broader measure of trend. As long as that longer-term average holds, many market participants will view dips as potential buying opportunities, keeping the possibility of a reassertion of the longer-term bullish trend alive.
Macro Drivers: Dollar Strength and Risk Appetite
Two primary macro factors pressured gold on the close. First, a rebound in the U.S. Dollar Index—supported by stronger-than-expected U.S. labor data—reduced the appeal of dollar-priced commodities such as gold. Historically, a firmer dollar makes gold more expensive for holders of other currencies and often weighs on bullion prices.
Second, renewed risk appetite following progress in trade discussions between the U.S. and its major trading partners, including the European Union and Japan, reduced safe-haven demand. When investors feel more confident about global trade and growth prospects, capital typically rotates out of haven assets like gold and into riskier assets such as equities.
Federal Reserve Outlook and Near-Term Scenarios
An upcoming Federal Reserve meeting adds another layer of sensitivity for gold. If the Fed’s statements or projections lack dovish signals—meaning little indication of rate cuts or a loosening of policy—gold could remain under pressure because higher or steady real interest rates increase the opportunity cost of holding non-yielding assets like gold. Conversely, any hint of easing or a softer economic outlook that reduces the likelihood of higher rates could quickly restore some of gold’s appeal.
Possible near-term scenarios include:
- If the dollar continues to strengthen and risk appetite remains robust, gold may test the downside targets near $3,310, $3,282, and $3,244.
- If the Fed delivers unexpectedly dovish guidance or incoming economic data weakens, gold could rebound and attempt to reclaim the 50-day SMA as resistance, setting up a potential recovery toward higher levels.
- Should the downtrend extend, the 200-day SMA near $2,991 stands out as a significant longer-term support area and a level that many market participants will watch closely for signs of renewed buying interest.
What Traders Are Watching
Market participants will be monitoring several items closely: any further developments in U.S.-EU and U.S.-Japan negotiations that affect global sentiment, incoming U.S. economic releases that could shift Federal Reserve expectations, and the behavior of the U.S. Dollar Index. Technical traders will also watch price reaction around the identified support zones and the interplay between the 50-day and 200-day moving averages for cues about trend direction.
In summary, gold’s drop below the 50-day SMA marks a clear short-term bearish signal, with immediate downside targets near $3,310, $3,282, and $3,244. Broader context—renewed risk appetite, a stronger dollar after solid labor data, and the Fed meeting—will help determine whether this pullback proves temporary or the start of a deeper correction, while the 200-day SMA near $2,991 remains an important long-term reference point.
Popular Topics
Picked from the archive
-
01
 Topics
Trump Imposes 50% Copper Tariff, Targets Pharma and Chips
-
02
Topics
Vietnam Ends State Gold Monopoly, Opens Market to Private Firms
-
03
Topics
Dollar Hits Multi-Year Low as $3.3T Trump Budget Spurs Debt Risk
-
04
Topics
Japan-U.S. Trade Talks Stall Ahead of July 9 Tariff Deadline
-
05
Topics
Goldman Sachs Predicts Fed May Start Cutting Rates by September
-
06
Topics
Trump to Impose Tariffs on Trade Partners Without Negotiations
-
07
Topics
Gold-Backed Crypto Tokens Surge as Investor Demand Spikes
-
08
Topics
How Inflation and Tariffs Are Reshaping U.S. Retail Spending