Why Gold Tumbled After the Hormuz Tanker Strike

Gold and silver market update — May 4, 2026
Key Takeaways
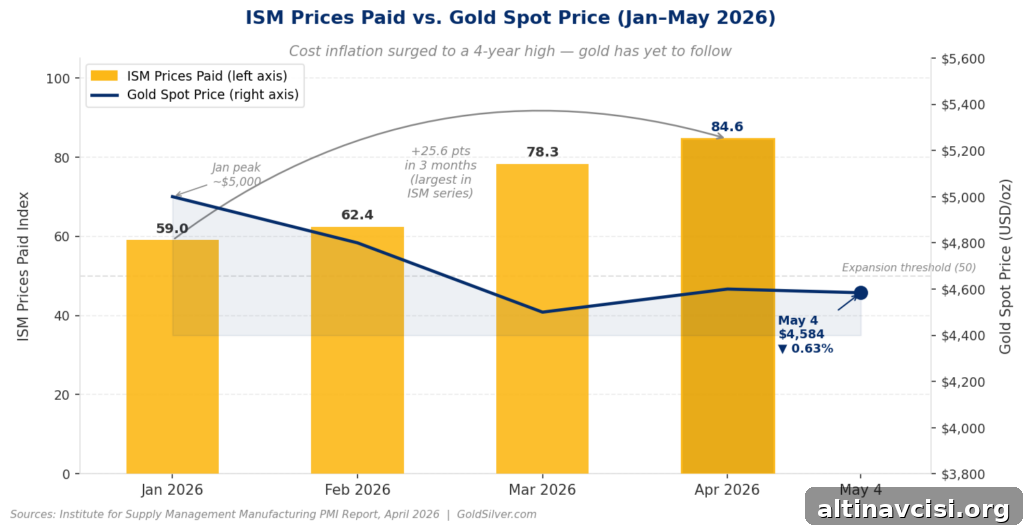
- Gold fell 0.63% to $4,584 on May 4, 2026. This decline came despite a tanker strike in the Strait of Hormuz and exceptionally high ISM input-cost readings. The muted reaction suggests the market has already priced a significant war premium, rather than signaling a weakened structural case for gold.
- ISM Prices Paid jumped to 84.6 in April 2026. That number represents an extreme surge in input costs — a 25.6 percentage-point rise over three months, the largest increase in the ISM series — while the Employment Index slipped to 46.4, a 2026 low. These readings point to stagflationary pressures in manufacturing, not merely projections.
- The Federal Reserve faces a difficult policy trade-off. Raising rates into a contracting labor market would be risky, and cutting rates while Prices Paid sit at 84.6 and PCE inflation is around 3.5% would be dangerous. Major institutions such as Goldman Sachs are keeping a year-end 2026 gold target of $5,400/oz, arguing that if the market accepts the Fed’s policy paralysis, real yields should compress and gold could accelerate higher.
Two Catalysts That Should Have Lifted the Gold Price — But Didn’t
On Monday, two developments arrived that, in many past episodes, would have pushed gold significantly higher. First, a commercial tanker was struck by projectiles in the Strait of Hormuz, the shipping chokepoint that moves a large share of the world’s traded oil. Second, the Institute for Supply Management’s April manufacturing report showed a massive jump in input costs. Yet gold declined.
Both events would normally support higher precious metal prices. Here’s what each means and why the market reaction was different this time.
The tanker strike in the Strait of Hormuz is noteworthy because that passage carries a substantial portion of global oil shipments. Heightened conflict there quickly pushes oil prices higher, feeds through to input costs for manufacturers, and ultimately raises consumer inflation. Ordinarily, geopolitical risk also drives safe-haven demand for gold.
The ISM’s Prices Paid reading — at 84.6 for April — is extraordinary. It climbed sharply from March’s level and marks one of the largest three-month increases on record in the ISM series. Simultaneously, the ISM Employment Index fell to 46.4, signaling contraction in manufacturing hiring. That mix — rising costs and falling employment — is the textbook definition of stagflation appearing in real-time data.
Why Did the Gold Price Fall on the Worst News Day in Months?
Since the Iran-related conflict began on February 28, 2026, gold has declined by roughly 13% while oil has risen more than 50% over the same period. This apparent paradox — higher oil but lower gold — is driven by inflation dynamics and monetary policy expectations.
War pushes oil higher, and higher oil raises input costs. Elevated input costs eventually translate into higher consumer inflation, which in turn pressures the Federal Reserve to keep policy restrictive. Higher policy rates tend to lift real yields and strengthen the dollar, both of which weigh on a non-yielding asset like gold. In other words, the inflationary consequences of the conflict have, paradoxically, become a drag on gold.
The Fed’s favored inflation gauge, the Personal Consumption Expenditures (PCE) price index, stood at around 3.5% in March 2026 and showed further upside risk in the pipeline. At the April 29, 2026 FOMC meeting — Jerome Powell’s last as chair — the Fed held the funds rate at 3.50–3.75% and registered several dissents, the most divided vote since the early 1990s. That split reflects uncertainty about the right policy path in the face of rising costs and a cooling labor market.
Nomination processes and leadership changes, such as Kevin Warsh’s pending confirmation, matter for policy expectations, but the core dilemma predates those transitions. The ISM data underscores why Fed policy appears constrained: companies are already paying record input costs even while hiring stalls, meaning consumer inflation readings will likely follow with a lag. PCE at 3.5% is a rearview signal; the pipeline suggests more pressure ahead.
Banks like Goldman Sachs are maintaining elevated gold targets because their scenario assumes the market eventually accepts a policy impasse. If investors conclude the Fed cannot or will not tighten enough to break the inflation cycle without severely damaging growth and public finances, real yields could fall and gold could re-accelerate.
What Does Gold’s Non-Reaction to the Hormuz Tanker Strike Actually Mean?
Gold’s small decline on a day with a notable tanker strike and a dramatic ISM input-cost surge is itself informative. In several prior geopolitical episodes — May 2019 U.S.–Iran tensions or Russia’s invasion of Ukraine in 2022 — gold moved sharply higher on the first day of escalation. This time, the market’s initial reaction to the February 28 conflict was already to price in a wartime premium. The latest escalation added little incremental risk premium.
Put differently, the market appears saturated with the war risk premium and simultaneously focused on the inflation-to-rate transmission. With record input costs and signs of a cooling labor market, a central bank that faces an impossible choice between hiking into weakening payrolls or easing into rising inflation is effectively cornered. Each month this position persists, real yields erode gradually, and the structural rationale for owning physical gold strengthens.
Gold does not necessarily need a fresh catalyst to move higher; it may simply need time for real yields to compress and for market consensus to shift toward an acceptance of policy paralysis.
What’s the Bear Case for the Gold Price Right Now?
The main bear-case scenario is straightforward: if core inflation accelerates meaningfully toward 4% and the Fed responds with further tightening, real yields would rise, the dollar would strengthen, and gold would likely suffer a correction. That outcome is possible and should be taken seriously.
But the scope for aggressive rate hikes is constrained by the U.S. government’s large debt burden and elevated annual interest costs. Debt-service payments already surpass $1 trillion annually, and the fiscal deficit remains large. Extremely aggressive, sustained rate hikes could destabilize public finances and aggravate broader economic stress. History shows the Fed can and has used very high rates in extreme circumstances, but today’s fiscal environment makes a Volcker-style response less feasible.
What to Watch: The May 8 Jobs Report and the Gold Price
On Friday, May 8, 2026, the U.S. Bureau of Labor Statistics will publish April nonfarm payrolls. Consensus estimates were near 53,000 jobs, down from March’s 178,000. That print will be a critical near-term test: continued labor-market weakness alongside strong inflationary signals would deepen the Fed’s policy dilemma and likely support gold’s longer-term case.
This is not a prediction of next week’s price action. It is a description of the environment in which gold tends to perform well: persistent inflationary pressures combined with a weakening real economy and a central bank with limited clean options.
Stay On Top of Gold & Silver Prices
Receive timely market alerts and commentary by email.
Sign up on the website to get updates and alerts about gold and silver markets.
SOURCES
1. Institute for Supply Management — Manufacturing PMI Report, April 2026
2. U.S. Bureau of Economic Analysis — Personal Income and Outlays, March 2026
3. Federal Reserve — FOMC Statement, April 29, 2026
4. Congressional Budget Office — Budget and Economic Outlook, February 2026
5. U.S. Energy Information Administration — Analysis of the Strait of Hormuz as an oil transit chokepoint
6. Goldman Sachs Commodity Research, May 2026 (institutional research)
7. CME Group — Gold futures and options market data
8. U.S. Senate Committee on Banking, Housing, and Urban Affairs — committee materials on nominations
9. U.S. Bureau of Labor Statistics — Employment Situation Summary
Disclaimer: This article is for informational purposes only and does not constitute financial or investment advice. Consult a qualified financial adviser before making investment decisions.
You May Also Like:
- Gold Is Up 41% From a Year Ago. The Fed Can’t Stop It
- 5 Economic Warning Signs Gold Investors Need to See Today
- WGC Q1 2026: What Asia Knows That Wall Street Doesn’t
- BEA Stripped Silver From GDP. Here’s What It Means
- PCE at 3.5%, GDP Miss: Why This Is Bullish for Gold
- How Warsh’s Inflation Measure Could Move the Gold Price
- Gold Is Down 19%. This $3.8B Bet Says It Doesn’t Matter
- Gold, Oil, and the Fed: Why the Old Rules Don’t Apply
Popular Topics
Picked from the archive
-
01
 Topics
Tariffs Boost Gold Prices Despite Weekly Drop Ahead of US Jobs
-
02
Topics
Could Trump’s Trade Wars End a Century of US Dollar Dominance?
-
03
Topics
Gold Tops $5,300 as Fed Meeting Sends Dollar Tumbling
-
04
Topics
Gold vs Silver: Which Metal Fits Your Portfolio?
-
05
Topics
Gold Prices Rise as Dollar Slips Ahead of Fed Rate Decision
-
06
Topics
How to Allocate Gold Between Stocks and Bonds
-
07
Topics
Gold Weekly: $9T Swing, Trump Fed Nominee, Record Premiums
-
08
Topics
Digital vs Physical Gold: What Do You Really Own?