COMEX Silver Coverage Ratio: Is Your Paper Silver Genuine?
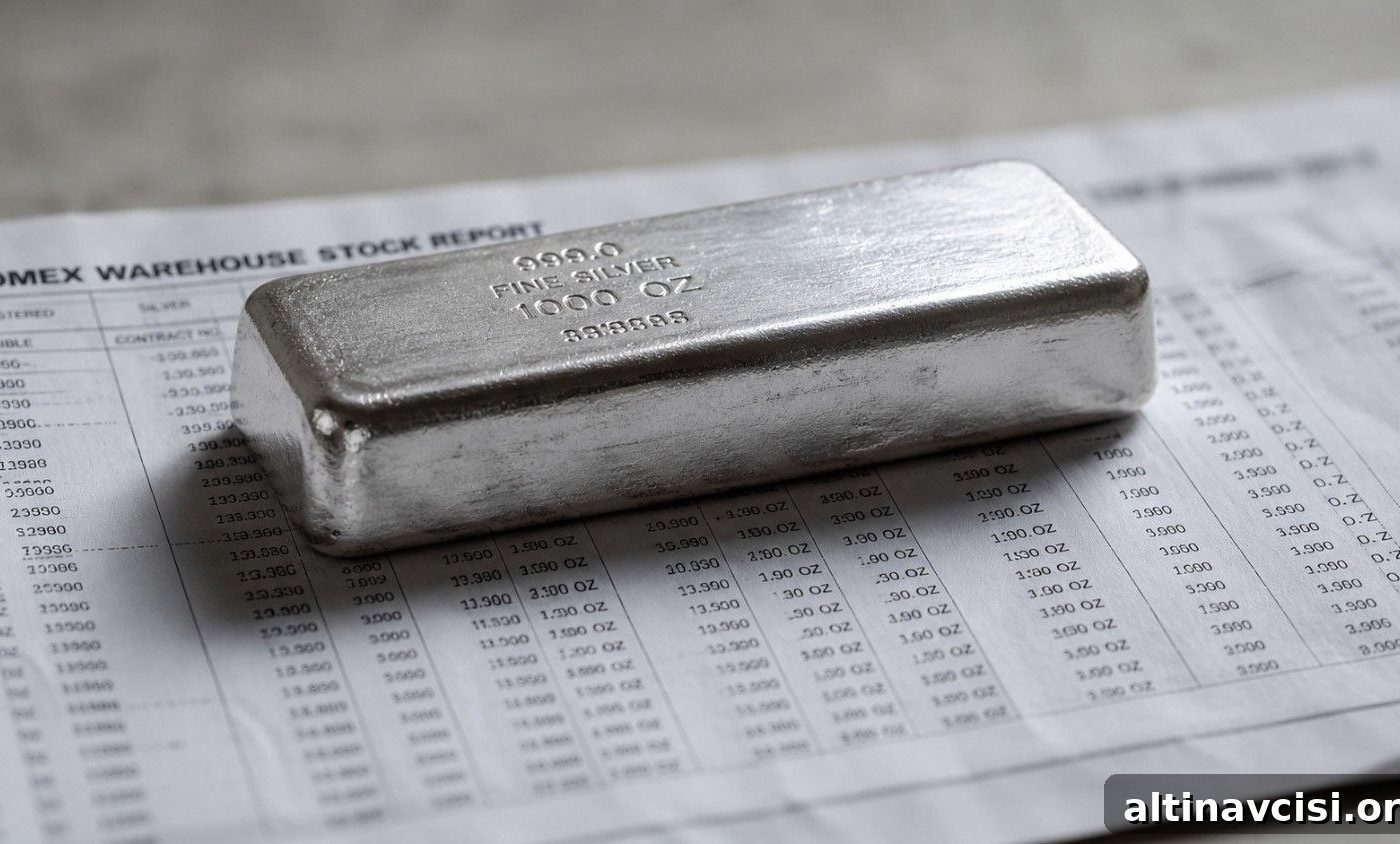
The COMEX silver coverage ratio shows how much physical silver is immediately available to satisfy outstanding futures contracts. Today that ratio stands near 13–14% — roughly one deliverable ounce for every seven paper ounces. The market functions because most futures are cash-settled and never require delivery, but this ratio has been below the 15% stress threshold for six months. A single week in January 2026 removed 26% of the entire deliverable pool, leaving the physical side of the silver market tighter than it has been in years.
Many investors holding silver through futures, ETFs, or unallocated accounts rarely consider what actually backs those claims. At present, the answer is more fragile than many assume. While prices corrected after January’s record highs, the physical inventory picture did not improve.
What Is the COMEX Silver Coverage Ratio?
The COMEX silver coverage ratio measures how much of the outstanding futures exposure could be settled with the metal held in exchange-approved warehouses. It’s calculated by dividing registered inventory by the total open interest measured in ounces. A 100% ratio would mean every paper claim is backed by deliverable silver — a scenario that has never existed. A reading of 13–14% means the buffer between paper promises and deliverable metal is unusually thin. Exchange analysts generally label readings below 15% as stress territory.

Your Gold Buying Guide Most investors overpay when buying gold — and often again when they sell. This guide explains what to own and why.
What’s the Difference Between Registered and Eligible Silver?
Not all silver in COMEX vaults can be used to settle futures contracts. That distinction is important when delivery pressure increases.
Registered silver has been allocated and cleared for delivery. A holder of a futures contract who requests physical settlement can receive registered metal.
Eligible silver resides in the same approved warehouses but is owned privately and has not been declared available for delivery. It meets exchange standards but cannot be used to settle contracts until the owner converts it to registered status.
The coverage ratio is calculated using registered inventory only. That matters because combining registered and eligible metal can create a misleadingly comfortable picture — eligible metal may not be deliverable when it counts most.
How Does Paper Leverage in the Silver Market Work?
Each standard COMEX silver futures contract represents 5,000 troy ounces. Open interest equals the total number of outstanding paper claims. With roughly 76.88 million ounces registered and open interest near 575.5 million ounces, the paper-to-physical leverage is about 7.5×. In other words, there are more than seven paper ounces for every ounce available to deliver.
That leverage falls within COMEX’s historical operating range of about 5–8× and is sustainable while the vast majority of contracts are rolled or cash-settled. The risk emerges if delivery demand increases markedly. If the portion of contracts demanding delivery rises from a typical 1–2% to 5–10%, the registered pool would come under significant strain.
What Do the Current Numbers Actually Tell Us?
January 2026 illustrated how quickly delivery inventory can shift. In a single week, COMEX registered inventory fell by 33.45 million ounces — roughly 26% of the deliverable pool. That drawdown was not fully replaced, so registered inventory entering the May 2026 delivery cycle remained smaller than it was before January’s outflow.
The longer-term supply backdrop adds pressure. The World Silver Survey 2026 reported a sixth consecutive annual deficit, projecting a 2026 shortfall of about 46.3 million ounces. Since 2021, the market has seen a cumulative drawdown of approximately 762 million ounces from above-ground stocks, leaving overall liquidity thinner and increasing the potential for larger price moves.
Put simply: the inventory supporting COMEX delivery is shrinking year after year, and registered inventories can be depleted quickly when demand for physical metal rises.
Does the COMEX Coverage Ratio Matter for Silver Investors?
Yes — but the relevance depends on how you hold silver.
If you own allocated physical silver — coins, bars, or segregated storage in your name — the COMEX coverage ratio has no direct effect. Your metal is held outside the COMEX delivery system.
If your exposure is through unallocated accounts, ETFs, or futures, the ratio matters more. The farther your holding is from a specific, audited bar in a named vault, the more it relies on the paper market functioning without stress. The distinction between owning physical metal and holding a claim on metal can become crucial during delivery events.
The coverage ratio does not predict timing. It signals how little margin the paper market has before physical constraints begin to influence price. Six consecutive years of deficits, the large cumulative drawdown since 2021, and the historic registered outflow in January are infrastructure indicators that increase risk of volatility, not guaranteed price forecasts.
Stay On Top of Gold & Silver Prices
Get timely market alerts sent directly to your inbox.
People Also Ask
What is a good COMEX silver coverage ratio?
Analysts typically view readings below 15% as stressed. Ratios above 30–40% indicate a well-buffered system. The current 13–14% reading has remained in stress territory for six months, making this one of the longer sustained stress periods on record.
What is the difference between registered and eligible silver at COMEX?
Registered silver is allocated for delivery and can be used to settle futures contracts. Eligible silver meets exchange standards and is kept in approved warehouses but is privately owned and not available for delivery until converted to registered status. Only registered silver counts toward the coverage ratio.
Can a COMEX silver short squeeze actually happen?
Partial squeezes are possible — in January 2026, 33.45 million ounces left registered inventory in a single week. A complete squeeze would require sustained, elevated delivery demand, which is rare. Still, the current combination of tight registered inventory and high open interest creates conditions where squeeze risk is higher than usual.
Does a low COMEX coverage ratio mean silver prices will rise?
A low ratio does not guarantee higher prices. It signals physical supply stress. When delivery demand rises against a thin registered pool, the market must either attract more metal into registered status or adjust prices to discourage delivery requests. In either case, low coverage increases price volatility.
Is silver in a silver ETF backed by the COMEX registered inventory?
Major silver ETFs typically hold allocated physical silver in their own custodial vaults, separate from COMEX warehouses. However, authorised participants move metal between markets during creation and redemption, so sustained physical tightness can affect ETF premiums and liquidity mechanics under stress.
What This Means for Your Silver
The COMEX silver coverage ratio is not a crash alarm. It is a measure of how much buffer exists between paper claims and deliverable metal — and that buffer is currently thin.
Consider the facts: registered coverage has been below 15% for six straight months; the projected 2026 deficit is roughly 46.3 million ounces, marking a sixth consecutive annual shortfall; since 2021 the market has seen a cumulative drawdown of about 762 million ounces; and in January 2026, 26% of the deliverable pool left registered inventories in a single week. Major industry reports describe this as an era of reduced stocks, signaling thinner liquidity and larger potential price swings.
Holding allocated physical silver means you own the metal itself rather than a claim on it. That ownership does not eliminate price volatility, but it does remove counterparty exposure tied to a clearinghouse honoring delivery claims. For those who want to understand current silver fundamentals and what it means to own physical metal, respected industry resources and annual market reports offer useful context.
SOURCES
1. CME Group — COMEX Daily Metal Stocks Report, Silver
2. Investing.com — Silver Coverage Ratio Near Stress Levels Ahead of COMEX May Delivery
3. Silver Institute / Metals Focus — World Silver Survey 2026
4. GoldSilver.com — Silver Market Deficit 2026: Six Years and Getting Worse
Disclaimer: This article is for informational and educational purposes only and does not constitute investment advice. Consult a qualified financial adviser before making investment decisions.
You may also like:
- What the Gold Price Per Ounce Really Tells You
- The Gold Inflation Paradox Most Investors Miss
- Insurance vs. Upside: Balancing Your Portfolio with Gold and Silver
- Gold Bullion vs. Jewelry: Why Serious Investors Choose the Bar
- Gold & Silver IRA: Why Starting Early Costs You Less
- Silver Fair Value: What the Data and History Show
- Gold or Silver Price Dip: Temporary Correction or Trend Reversal?
- What Switzerland’s Gold Freeze Means for Investors
Popular Topics
Picked from the archive
-
01
 Topics
Tariffs Boost Gold Prices Despite Weekly Drop Ahead of US Jobs
-
02
Topics
Could Trump’s Trade Wars End a Century of US Dollar Dominance?
-
03
Topics
Gold Tops $5,300 as Fed Meeting Sends Dollar Tumbling
-
04
Topics
Gold vs Silver: Which Metal Fits Your Portfolio?
-
05
Topics
Gold Prices Rise as Dollar Slips Ahead of Fed Rate Decision
-
06
Topics
How to Allocate Gold Between Stocks and Bonds
-
07
Topics
Gold Weekly: $9T Swing, Trump Fed Nominee, Record Premiums
-
08
Topics
Digital vs Physical Gold: What Do You Really Own?