Gold Price Up 41% YoY, Fed Can’t Stop the Rally
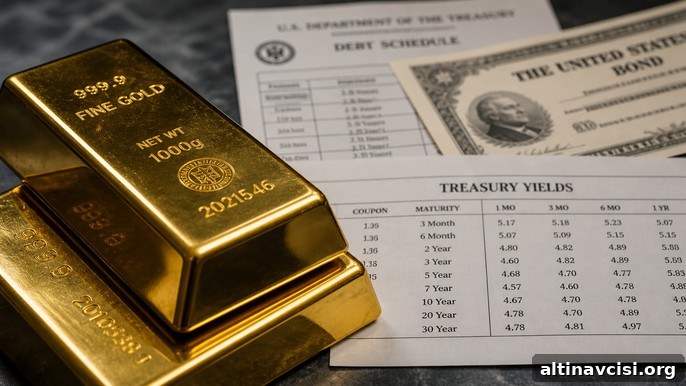
Gold and silver market update — May 1, 2026
Key Takeaways
- The April 29 FOMC produced four dissents — the most divided vote since 1992 — and Q1 PCE inflation accelerated to a 4.5% annualized quarterly pace. Recent data have strengthened the hawkish case at the Fed.
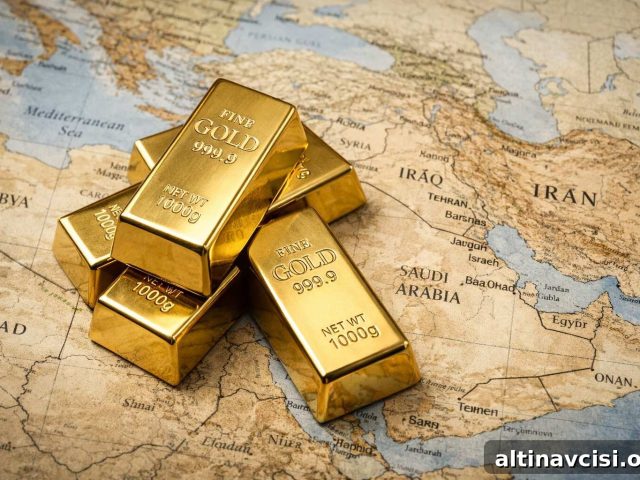
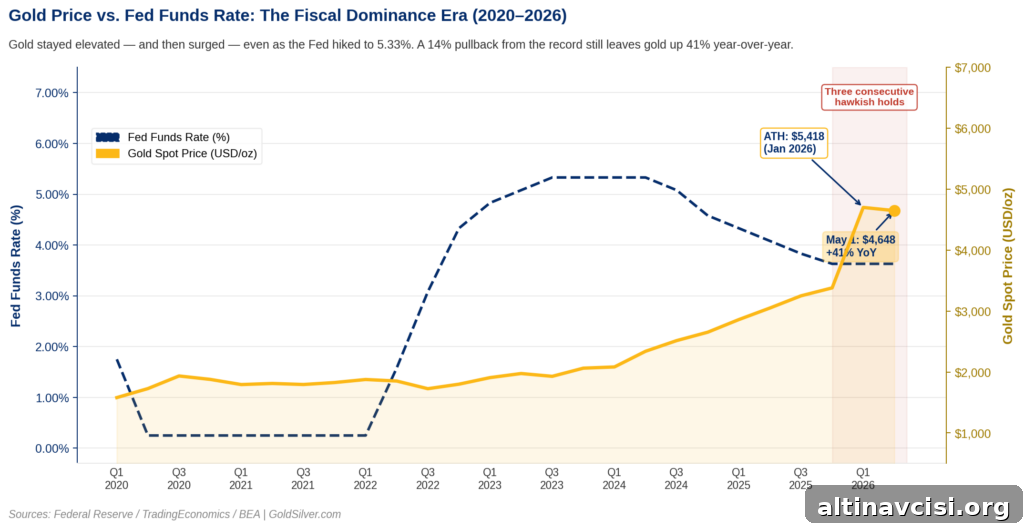
- Gold trades near $4,600/oz, up roughly 41% year-over-year despite a roughly 14% retreat from January’s record high. That resilience through geopolitical and monetary stress is the key structural story.
- “Fiscal dominance” — with U.S. interest payments on the debt exceeding $1 trillion annually at current rates — constrains how aggressively any Fed chair can tighten policy. The limit is arithmetic rather than purely political.
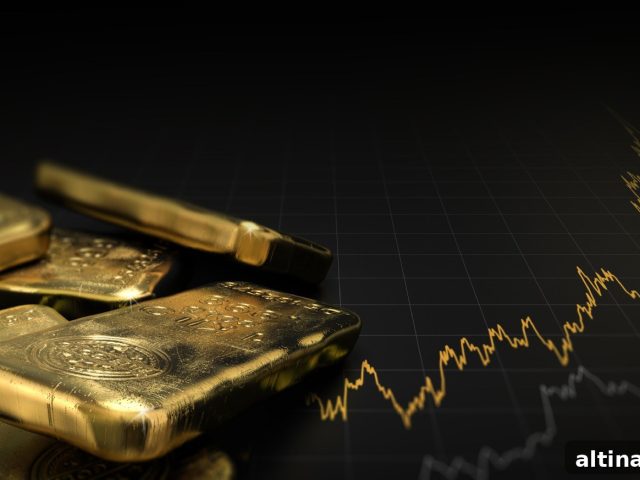
As of 1:24 PM ET on May 1, 2026, the gold price sits around $4,600 per ounce, down about 1% for the day and up roughly 41% compared with a year ago. It has also declined approximately 14% from the January record high of $5,418. Both figures are accurate and tell different parts of the same story: a large annual gain and a healthy pullback from extremes.
The 41% year-over-year gain matters most. Those profits have endured a regional war, three consecutive hawkish Fed holds, and the most fractured FOMC vote in decades. A 14% correction from an all-time high in that context looks like consolidation, not capitulation — a potential floor for the market rather than evidence of a broken trend.
What does a four-way FOMC dissent mean for gold?
On April 29 the Federal Open Market Committee voted 8–4 to keep the federal funds rate in the 3.50%–3.75% range. That outcome included three regional presidents pressing to remove the easing bias from the statement, signaling they expect policy to remain restrictive for longer than the majority suggested. One governor dissented in favor of an immediate cut.
The following day, the Bureau of Economic Analysis released the advance Q1 numbers. Real GDP rebounded at a 2.0% annualized rate, while the PCE price index — the Fed’s preferred inflation gauge — jumped to a 4.5% annualized quarterly pace, with core PCE near 4.3% on the same basis. Year-over-year PCE readings also climbed, marking some of the highest annual inflation rates in roughly two years.
These figures describe an inflationary expansion: growth alongside re-accelerating price pressures. In that environment the argument for cutting rates weakens considerably. Major financial firms have adjusted their forecasts accordingly, pushing out anticipated rate cuts and leaving the market to price a longer period of elevated policy rates.
Can Warsh actually tighten policy with $1 trillion in annual debt interest?
Kevin Warsh cleared the Senate Banking Committee in a party-line vote on April 29. A full Senate confirmation could come no earlier than the week of May 11, while the sitting chair’s term expires on May 15. Warsh has publicly argued for a smaller Fed balance sheet, stronger inflation credibility, and less forward guidance — in short, a more hawkish approach.
Those hawkish instincts confront a structural constraint often described as fiscal dominance. Fiscal dominance arises when high government interest costs make it difficult for the central bank to raise rates without creating unsustainable borrowing costs. At current yields the U.S. pays more than $1 trillion a year in interest on federal debt. Further rate increases would raise interest expense, potentially forcing larger Treasury issuance and exerting upward pressure on yields. Over time, that dynamic could compel the central bank to step in and purchase bonds, expanding the money supply and undermining the disinflationary objective it initially pursued.
This is not primarily about political independence; it is about arithmetic. Higher policy rates increase the government’s interest bill and can create a feedback loop that limits how far and how fast tightening can go without broader fiscal or structural changes.
Why hasn’t the gold price fallen while the Fed holds rates high?
Observers often point to 1992, the last year with a four-way FOMC dissent, when gold largely traded sideways for a decade. That historical comparison misses a key difference: the fiscal backdrop. In 1992 the U.S. deficit and total debt were far smaller relative to today’s levels. The fiscal room that helped the Fed restore credibility in the 1990s is not present in the same form now.
Gold’s performance through recent shocks — geopolitical risk, repeated hawkish policy statements, and leadership uncertainty at the Fed — suggests the market is pricing persistent fiscal and monetary risk. A non-yielding asset that preserves large gains while rates remain elevated signals investor concern about long-term fiscal sustainability and potential future monetary expansion.
Silver trades near $73/oz, roughly 40% below its January 2026 peak of $121.67/oz. Silver’s price remains affected by the persistent structural supply deficit, but it is also more sensitive to industrial demand than gold. Higher-for-longer rates can pressure manufacturing activity, so the gold-silver ratio is a useful barometer: when industrial demand recovers, silver should outperform and the ratio will compress.
Three dates every gold investor should watch before June
Three near-term events matter for gold and the broader monetary outlook: the Senate floor vote on the Fed nominee the week of May 11, the expiration of the current Fed chair’s term on May 15, and the first FOMC meeting under new leadership with updated projections on June 17. Market pricing currently places a high probability on another hold in June. If inflation readings remain elevated before that meeting, the dissenting hawks could gain more support inside the Committee.
A divided central bank, fiscal constraints, and a gold price that remains substantially higher than a year ago — even after a correction from record levels — frame the next phase of this market story. For investors, the critical question is whether a new Fed chair can navigate a narrow policy path between disinflation and the fiscal realities that complicate aggressive tightening.
SOURCES
1. Federal Reserve — FOMC Statement, April 29, 2026
2. Federal Reserve — Press Conference Transcript, April 29, 2026
3. Bureau of Economic Analysis — GDP Advance Estimate, Q1 2026
4. Bureau of Economic Analysis — Personal Income and Outlays, March 2026
5. Reuters via Investing.com — Coverage on Morgan Stanley outlook for Fed policy in 2026
6. CME Group — FedWatch Tool, June 2026 rate probabilities
7. TradingEconomics — Gold price historical data
8. TradingEconomics — Silver spot price, May 1, 2026
9. CNBC — Coverage of Fed nominee Senate committee vote
10. Congressional Budget Office — Historical budget and interest payment data
Disclaimer: This article is for informational purposes only and does not constitute financial or investment advice. Consult a qualified financial adviser before making investment decisions.
You May Also Like:
- 5 Economic Warning Signs Gold Investors Need to See Today
- WGC Q1 2026: What Asia Knows That Wall Street Doesn’t
- BEA Stripped Silver From GDP. Here’s What It Means
- PCE at 3.5%, GDP Miss: Why This Is Bullish for Gold
- How Warsh’s Inflation Measure Could Move the Gold Price
- Gold Is Down 19%. This $3.8B Bet Says It Doesn’t Matter
- Gold, Oil, and the Fed: Why the Old Rules Don’t Apply
- Why Turkey Sold Its Gold Reserves — And What It Proves About Sound Money
Popular Topics
Picked from the archive
-
01
 Topics
Money Manager Sues Fed Chair Powell to Force Public Rate Talks
-
02
Topics
Gold Safe-Haven Demand Returns After 9-Day Selloff
-
03
Topics
ETF Inflows Propel Gold Demand to Highest H1 Levels Since 2020
-
04
Topics
Top Economist Warns of U.S. Recession as Fed Options Shrink
-
05
Topics
10-Year Treasury Yield Rises After Tariff News, Services Data
-
06
Topics
Gold Demand in China Drops 3.5% in H1 2025
-
07
Topics
Should You Buy Gold Now During a Dip? Timing and Risks
-
08
Topics
Gold Tops $5,300 as Fed Meeting Sends Dollar Tumbling