Gold Flat, Silver Down 2.3%: Gold-Silver Ratio Signals Tomorrow
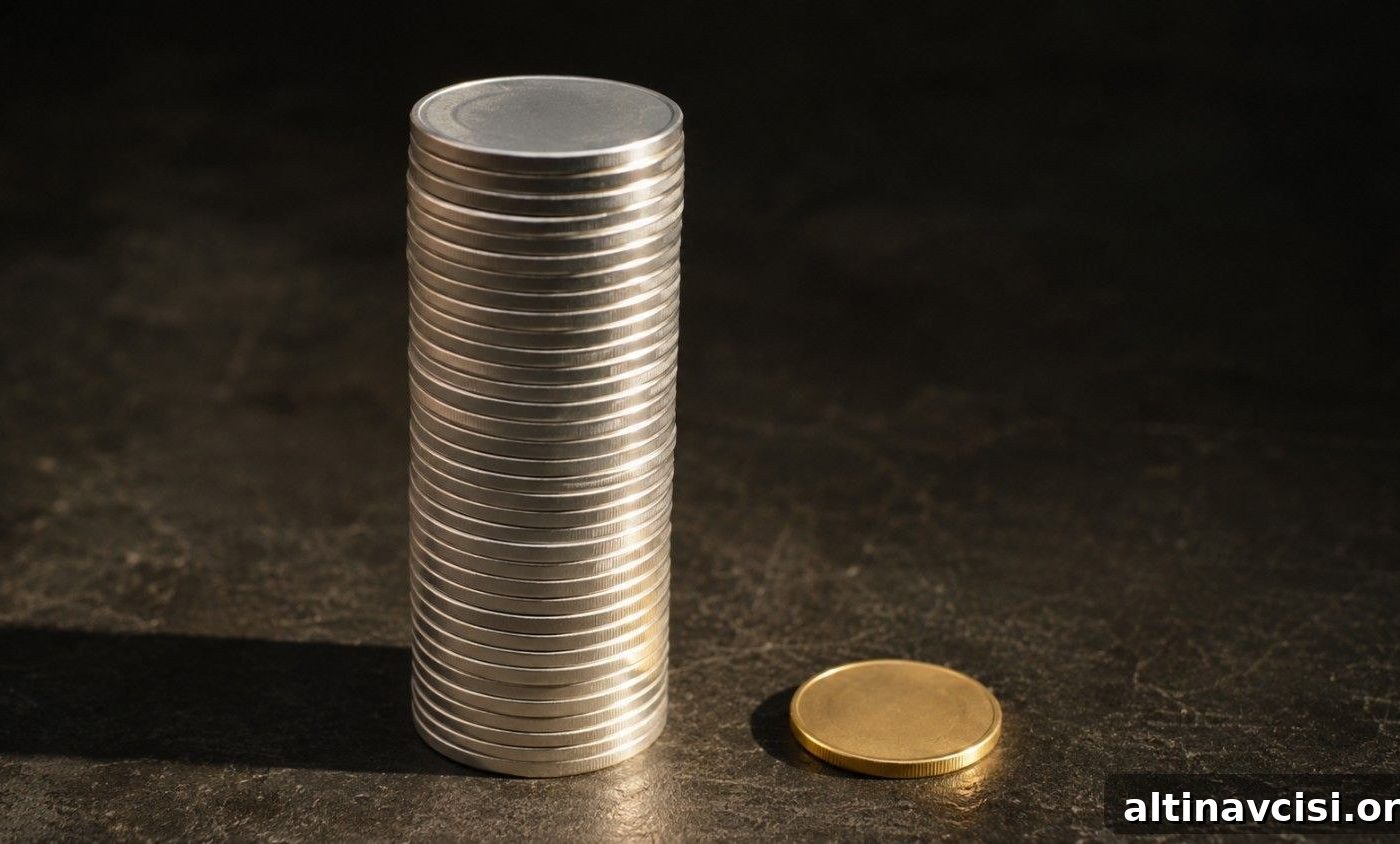
Yesterday silver outperformed gold, pushing the gold-silver ratio down to about 66.5. Today that move reversed: silver fell roughly 2.3% while gold held essentially flat, and the ratio widened back to roughly 67.5. Five market developments explain the session’s action. The common theme is that tomorrow’s July Consumer Price Index (CPI) release will likely determine whether any of these trends persist.
Why Did the Gold-Silver Ratio Widen to 67.5 Today?
Silver briefly traded above $66 — its highest since June — before reversing sharply. By early afternoon it had dropped about 2.3%, while gold reached an intraday high near $4,435 and then gave it back, finishing the session effectively unchanged. That divergence pushed the gold-silver ratio from yesterday’s 66.5 to about 67.5 in one session.
The direction is meaningful. A ratio near 67.5 sits above the roughly 50-year historical average of about 65, implying that silver looks relatively cheap versus gold on a long-term basis. When silver underperforms gold right before a major inflation print, markets are often pricing in a stronger Federal Reserve response — namely a rate hike. Higher real yields typically punish silver more than gold because silver carries significant industrial demand, which is more sensitive to rate-driven economic slowdown. Gold, by contrast, is a purer monetary metal and tends to hold up better in those scenarios.
Put simply: a softer CPI would likely narrow the ratio as silver recovers, while a hotter-than-expected CPI would tend to widen it further.

The Edge Every Investor Needs
Smarter precious metals investing starts here. The Nuggets Newsletter delivers timely market insights, Fed updates, global trends, and educational material for investors focused on gold and silver.
What Does the Barrick-Newmont $1.95 Billion Settlement Mean for Gold Investors?
Barrick Mining and Newmont reached a $1.95 billion cash settlement related to the Fourmile deposit and their Nevada Gold Mines joint venture. As part of the agreement, Newmont agreed to Barrick’s planned North American IPO, which Barrick aims to complete by the end of 2026. Barrick also reported Q2 net earnings of $1.22 billion (about $0.73 per share), a 55% year-on-year increase, though adjusted EPS of $0.82 narrowly missed the $0.83 consensus after higher fuel costs and a retroactive tax assessment in Mali.
Markets reacted negatively to the settlement. Barrick’s shares fell by as much as 9% on the Toronto Stock Exchange. Commentators estimated an implied valuation for Fourmile that many felt favored Newmont, and that view helped weigh on miner stocks.
The episode highlights an important distinction: mining companies often trade at a discount to the metal itself because they carry operational, geopolitical, and execution risks that physical gold does not. Physical gold removes that layer of company-specific uncertainty and counterparty risk.
Are More People Buying Physical Silver Even as the Price Falls?
Perth Mint data showed silver product sales totaled 293,732 ounces in June 2026, the lowest monthly volume of the year; July figures were not yet available at the time of reporting. That context matters because demand for physical metal often rises when paper prices weaken. Buyers who had sat on the sidelines earlier stepped in as spot silver moved well below January’s peak, preferring physical bullion to momentum trading strategies.
Structural supply dynamics support that behavior. The Silver Institute projected another annual supply deficit in 2026, with a sizable shortfall measured in tens of millions of ounces. Since 2021, cumulative draws on above-ground silver stocks have been substantial, creating a gap that mine production cannot close quickly because new projects typically require many years to reach full production.
In short, rising physical demand amid falling paper prices is not contradictory: price dips often attract buyers, while the structural deficit remains largely independent of short-term spot moves.
Is China Still Buying Gold — and by How Much?
China’s central bank added roughly 19.9 metric tonnes (about 640,000 troy ounces) to its gold reserves in July, marking the largest single-month purchase since October 2023 and extending its buying streak to 21 consecutive months. Official reserves rose to a new record near 2,366 tonnes.
Purchases appear steady and deliberate rather than momentum-driven: the central bank has been adding gold in measured increments across recent months while prices remained below their January peak. Even with these additions, gold still makes up less than 10% of China’s overall reserve portfolio, indicating substantial room for continued accumulation if the policy posture persists.
Separately, domestic Chinese gold ETFs have recorded consistent inflows, attracting institutional capital as equity market volatility nudges investors toward alternative stores of value.
What Could Tomorrow’s CPI Report Do to Gold and Silver Prices?
The July Consumer Price Index is scheduled to print Wednesday morning (8:30 a.m. ET). Market-implied probabilities for a September Fed hike were roughly balanced at the time of writing, which places the CPI report in a position to move markets materially in either direction.
A softer-than-expected CPI would likely ease the rate-hike narrative, pull Treasury yields lower, and open upside for gold—potentially pushing it toward new intraday highs. Silver typically recovers more sharply in such scenarios, narrowing the gold-silver ratio as investors rotate back into industrial and monetary demand for silver.
Conversely, a hotter-than-expected CPI—driven by energy costs or other inflationary pressures—would strengthen the case for additional Fed tightening. That outcome would likely pressure both metals, but silver would feel the pinch more acutely because of its greater industrial exposure, and the gold-silver ratio would probably widen further. Rising 10-year Treasury yields, which climbed during the recent session, already contributed to gold surrendering its intraday high.
SOURCES
1. Bloomberg — Strait of Hormuz reporting and market context
2. Mining Weekly — Coverage of the Barrick-Newmont agreement
3. Mining.com — Reporting on Barrick executive moves and restructuring
4. Barrick Mining / GlobeNewswire — Second quarter 2026 results and company statements
5. Perth Mint — June 2026 sales data and retail bullion figures
6. Bloomberg — China central bank gold reserve purchases in July 2026
7. Reuters / Kitco — Gold market commentary and inflation expectations
8. Silver Institute — World Silver Survey 2026 supply-demand analysis
9. World Gold Council — Central Bank Gold Reserves Survey 2026
10. GoldSilver — Live spot price data and historical charts
11. CME Group — FedWatch Tool and rate probability data
Disclaimer: This article is for informational purposes only and does not constitute investment advice. Past performance is not indicative of future results. Always consult a qualified financial advisor before making investment decisions.
You May Also Like:
- Gold Slipped at the Open. China Bought the Dip. Again.
- Why Is Silver Outperforming Gold Today? The Dual-Engine Mechanism Explained.
- Trump Just Said the US Is Only ‘Semi-Negotiating’ With Iran. That One Word Changes Everything for Gold.
- Gold Opened at Its Highest Level Since June. Five Things Are Keeping It From Going Higher.
- Gold Had Its Best Week Since January. Wednesday’s CPI Could Take It Back.
- Gold Just Climbed to a 7-Week High. One Number Changed Everything.
Popular Topics
Picked from the archive
-
01
 Topics
Bond King Jeffrey Gundlach’s Gold Signal for Investors
-
02
Topics
Federal Reserve Goes Silent: Why Gold Investors Don’t Need It
-
03
Topics
Do Gold ETFs Mean You Own Physical Gold?
-
04
Topics
Gold, Silver and Stagflation: 5 Market Signals to Watch
-
05
Topics
Silver Price Outlook May 2026: Focus on Trends, Not Numbers
-
06
Topics
How the Federal Reserve Shrunk the Dollar’s Value 97% Since 1913
-
07
Topics
BEA Removed Silver From GDP: What It Means
-
08
Topics
South Korea’s Central Bank Resumes Gold Purchases After 13 Years