Federal Reserve Goes Silent: Why Gold Investors Don’t Need It
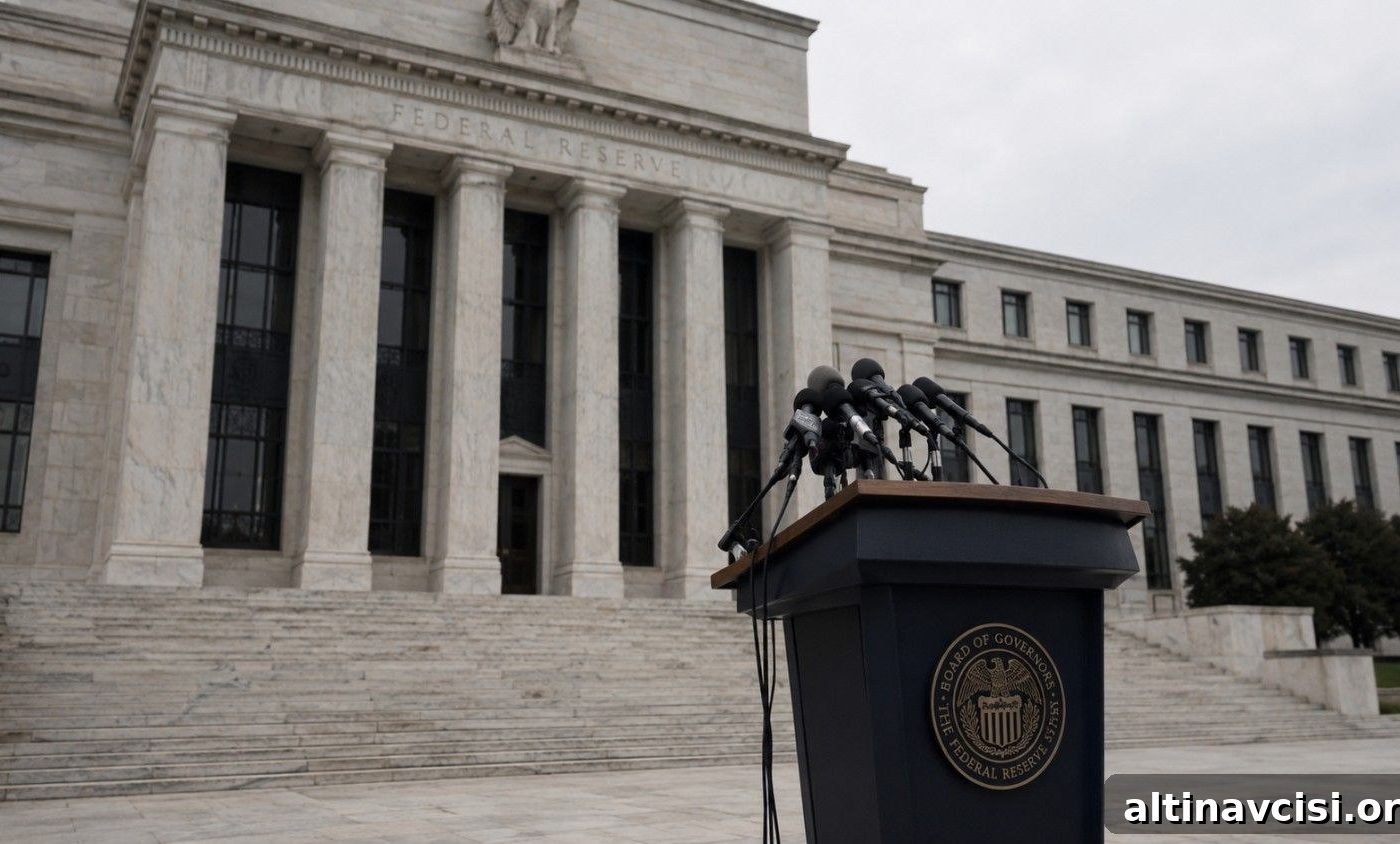
At his first Federal Open Market Committee (FOMC) meeting on June 17, 2026, Fed Chair Kevin Warsh removed the Federal Reserve’s forward guidance framework and declined to release the familiar dot-plot projections. Such a move — abandoning two long-standing communication tools together — is unprecedented in the post-2008 era. The immediate market response included a roughly 2% drop in paper gold prices before most of that loss was recovered. For holders of physical gold, however, the fundamental investment case remains intact.
Gold is trading at $4,259.63 this morning, up 0.03%.
What Did the Fed Change?
Forward guidance is the Fed’s practice of signaling likely future interest-rate moves to help markets form expectations. It began in December 2008 as central bankers sought to shape investor expectations after cutting policy rates to the effective lower bound. The dot plot — a chart showing each official’s individual interest-rate projection — was introduced in January 2012. For more than a decade the two tools together gave markets a preview of the Fed’s likely path.
Chair Warsh eliminated both of those communication tools. The official post-meeting statement was dramatically shorter than prior releases: about 130 words versus a 341-word statement in April. Language that previously indicated the “likely future course of monetary policy” was removed, replaced by a compact summary of current conditions and a renewed commitment to price stability.
At the press conference Warsh said plainly, “We’ve dropped forward guidance.” He added that, as a general matter, forward guidance is not something the Fed should be in the business of providing. He also became the first Fed Chair to withhold a dot-plot projection, announcing a task force to review whether the dot plot should continue to be published.
Markets reacted quickly. Short-term Treasury yields rose — two-year yields jumped roughly 16 basis points — while the dollar strengthened about 1%, marking one of its best daily performances in nearly a year. Paper gold initially fell about 2% on the announcement, then recovered most of that move over the following sessions.
Gold Spot Price — 30 Days to June 18, 2026
Spot price USD/oz — paper market reaction to FOMC vs. structural floor
Over the 30 days leading up to June 18, 2026, gold moved from a mid-May correction low near $4,072 through a recovery that peaked around $4,382 on June 15, then sold off intraday on the June 17 FOMC to roughly $4,240 before settling near $4,260 on June 18. That sequence reflects a mix of geopolitical developments, macro surprises and a volatile policy communication event.
Source: GoldSilver editorial summary of spot market moves
What Does This Mean for Physical Gold?
Paper gold—futures and exchange-traded products—prices move primarily in response to real yields: Treasury yields adjusted for inflation. When the Fed telegraphed its path, traders could price those yield expectations well in advance, which often kept market volatility relatively contained around policy events.
A central bank that goes silent changes that dynamic. Without an explicit rate path from the Fed, expectations about yields can swing more widely from one data release or geopolitical development to the next. That heightened uncertainty tends to amplify short-term moves in the paper market and can produce sharper intraday swings.
That increased volatility is largely confined to paper markets. Physical gold carries no counterparty risk, is not subject to margin calls, and its weight and purity do not change based on policy statements. An ounce of physical gold today is the same tangible asset it was before Chair Warsh’s remarks.
The longer-term rationale for owning physical gold relies on structural forces that forward guidance did not create and that the Fed’s communication change did not undo. Three durable data points underpin that view: the reality of rising interest-cost burdens on government debt (with interest payments compounding into the deficit at roughly $1 trillion per year), continued central-bank purchases (244 tonnes of net buying in Q1 2026, according to the World Gold Council), and persistent inflation that has averaged well above the Fed’s 2% target (the latest figures show inflation near 4.2%). These conditions support demand for a non-sovereign, no-counterparty store of value.
The Edge Every Investor Needs
Smarter precious metals investing starts here. The Nuggets Newsletter brings essential market insights, Fed updates, global trends, educational videos, and practical analysis for long-term investors.
What Did the June Dot Plot Actually Project?
Although Chair Warsh withheld a dot plot at the press conference, the Federal Reserve’s June 2026 Summary of Economic Projections that accompanied the meeting conveyed a hawkish tilt. Nine of 18 voting members projected at least one rate hike this year, and the median year-end federal funds rate rose to 3.8% from 3.4% in March. The Fed’s PCE inflation forecast for 2026 was revised to 3.6%, materially higher than the outlook issued three months earlier.
Warsh cautioned that each official’s dot is not a binding promise: “written in pencil with an eraser,” he said. Projections can and do change with new data. If energy prices fall faster than expected — for example, if disruptions ease and supply normalizes — inflation could roll back more quickly and render the June projections overly hawkish in hindsight. The next major data point to watch is the June Consumer Price Index, due July 14; that reading will either reinforce the hawkish median or begin to erode it.
Gold trading around $4,259 remains about 24% below its January 28, 2026 all-time high of $5,589. Still, major bank forecasts for year-end targets sit well above current levels: Goldman Sachs at $5,400, JPMorgan and Bank of America around $6,000, and Morgan Stanley near $5,200. Those firm targets are grounded in structural drivers—monetary, fiscal and geopolitical pressures—not on whether the Fed publishes an explicit rate path.
Does Any of This Change the Case for Gold?
No. The Fed has altered its communication strategy, but it has not changed the primary reasons investors allocate to gold. The short-term market structure has become less predictable without forward guidance: short-term Treasury yields spiked, paper gold sold off and then recovered. Those are market reactions to a shift in information flow, not changes in the metal’s intrinsic characteristics.
The broader arithmetic remains: inflation running well above the Fed’s target, rising interest burdens on government debt, and sustained central-bank purchases create a structural environment in which a tangible, non-sovereign store of value retains appeal. Those are the drivers that underlie institutional price forecasts and that support a long-term allocation to physical gold.
Stay On Top of Gold & Silver Prices
Get important market alerts and timely analysis sent straight to your inbox.
SOURCES
1. Federal Reserve — FOMC Statement; Summary of Economic Projections (Dot Plot); Press Conference — June 17, 2026
2. CME Group — FedWatch Tool, June 18, 2026
3. Bureau of Labor Statistics — Consumer Price Index, May 2026
4. World Gold Council — Gold Demand Trends Q1 2026
5. Committee for a Responsible Federal Budget — Analysis of interest payments and the federal budget
6. GoldSilver — Gold & Silver Spot Prices, June 18, 2026
7. Goldman Sachs Global Research — Gold Price Forecast 2026
8. J.P. Morgan Global Research — Gold Price Predictions 2026–2027
9. Morgan Stanley Commodities Research — Gold Price Forecast, April 2026
10. Bank of America Global Research — Gold Price Target, May 2026
Disclaimer: This article is for informational purposes only and does not constitute financial or investment advice. Consult a qualified financial adviser before making investment decisions.
You May Also Like:
- Five Signals That Say Gold’s Correction Is a Reset, Not a Reversal
- The Fed Just Killed Its Rate Roadmap. Here’s What That Means for Gold.
- Gold Holds at $4,347 While Stocks Hit All-Time Highs. Here’s Why.
- Why Is Silver Up Today? The Iran Deal Changed the Fed Math
- Gold Up 3%, Silver Up 4.7%: Five Forces Driving Metals Higher Today
- Iran Peace Deal Sends Oil Down 5%, Gold Up 3%
- Gold & Silver Surge on Iran Peace Deal — Then Pull Back
- Silver Fell 22% in 30 Days. Gold-Silver Ratio Hits 63.
- Every Bearish Catalyst Landed at Once. Gold and Silver Went Up Anyway.
- Gold at Seven-Month Lows: Why Geopolitical Fear Is Not Enough
Popular Topics
Picked from the archive
-
01
 Topics
Gold Price Drops From Peak as Central Banks Continue Buying
-
02
Topics
Gold’s Bull Run: Fed Rate Cuts and China Buying Drive $5K Target
-
03
Topics
Why China’s Silver Imports Soared to a Record in 2026
-
04
Topics
Silver Eagle vs Maple Leaf vs Britannia: Which Has More Silver?
-
05
Topics
Gold Drops 19%: $3.8B Investor Bet Says It Won’t Matter
-
06
Topics
Trump Putin Summit and Jackson Hole Threaten Stock Bull Run
-
07
Topics
Optimize Portfolio with the 80/60 Gold-Silver Rule
-
08
Topics
Why Investors Are Buying Gold After Today’s Price Drop