Silver Price Spikes to $69.85, FOMC Erases Gains
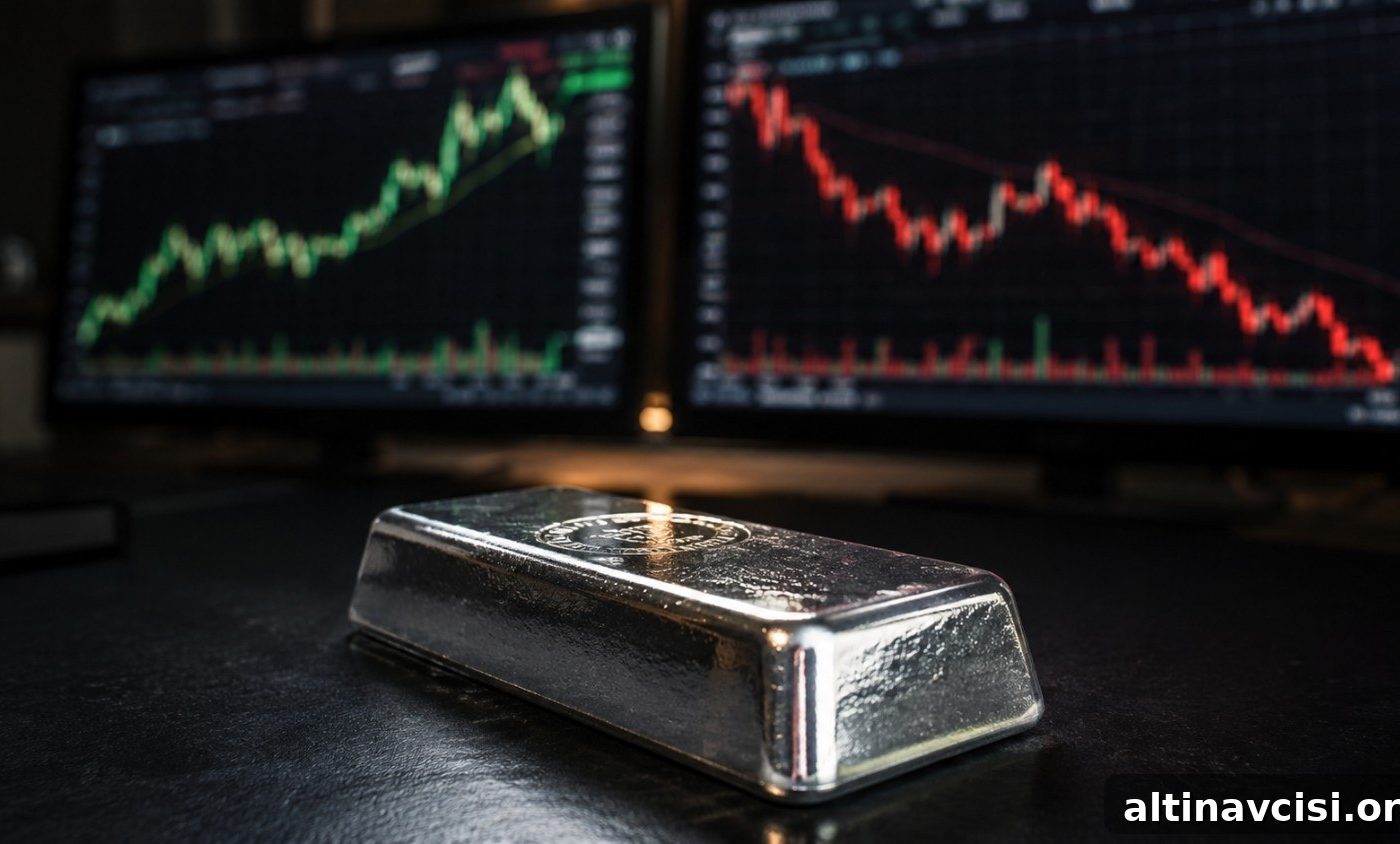
Silver opened the session at $67.94 and surged to $69.85 — a 2.8% intraday gain — after markets digested news of the Iran peace deal and its likely consequences: lower oil, softer inflation expectations and reduced pressure on the Federal Reserve to raise interest rates. For a brief period both of silver’s core demand drivers were clearly at work.
Later in the session, however, the Federal Open Market Committee (FOMC) outlook reasserted its influence.
By mid-day the rally had been fully reversed: silver dropped to a low of $66.05 and finished around $66.31. Gold barely budged, slipping about 0.22% and holding near $4,248. The gold-to-silver ratio widened to roughly 64.05. One trading day captured the two competing forces that have dominated silver’s price action in 2026 and which force is currently dominant.
The Edge Every Investor Needs
Smarter precious metals investing starts here. The Nuggets Newsletter delivers timely market analysis, Fed updates, global trends, educational videos and more.
What Happened to the Silver Price Today?
Silver’s price behavior reflects two separate demand engines. The first is monetary: silver reacts to real yields, the U.S. dollar and expectations for interest rates — the same macro forces that drive gold. The second is industrial: silver is essential in solar panels, electric vehicles, data center components and many advanced electronics. That industrial demand does not answer directly to central bank decisions, but it is still influenced by broad economic trends.
When reports of an Iran peace accord reached markets, both engines lit up. Lower geopolitical risk pushed oil prices down, easing inflation expectations and reducing the odds of aggressive Fed tightening. Softer rate expectations reduce real yields, which supports precious metals. At the same time, lower oil and energy costs improve manufacturing margins and strengthen the industrial case for silver. The market reacted quickly: silver climbed to $69.85 on the Iran-driven bid.
That upside was short-lived. The FOMC’s June projections reminded traders that rate-risk remains meaningful. In the committee’s dot-plot, nine of 18 officials still anticipated at least one rate hike this year; the median year-end policy rate rose to 3.8% from 3.4% in March, and the Fed’s PCE inflation projection stood at 3.6%. The Fed’s guidance choices signaled that it is not committing to a fixed path rather than saying inflation is definitively behind us. For markets, that distinction meant elevated rate-hike odds persisted, pushing real yields higher and undercutting silver’s monetary bid.
In short: the Iran-news-driven rally was real and economically logical, but the Fed outlook reintroduced downward pressure. That tug-of-war explains the intraday reversal.
Silver Intraday Price — June 18, 2026
USD per troy ounce · New York session (ET)
Intraday highlights: open $67.94 → high $69.85 (Iran deal bid, +2.8%) → low $66.05 (FOMC reassertion) → close ~$66.31.
Source: Intraday New York session pricing, June 18, 2026.
Why Did Silver Fall More Than Gold Today?
On the same day gold fell roughly 0.22%, silver lost about 2.36% — a much larger move. That divergence is not a random occurrence but a feature of how the two markets are structured.
Gold’s core demand is heavily monetary and institutional: central banks, long-term holders and investors focused on purchasing power protection. These buyers are less prone to the rapid in-and-out flows that react to short-term shifts in rate expectations, so gold has a sturdier structural floor.
Silver’s investment constituency is different. Its monetary bid is shallower and more reactive; funds and traders who move quickly can amplify price swings when rate expectations change. Historically, silver exchange-traded fund flows have shown faster and larger outflows than gold in tightening scenarios. That amplifies declines when the monetary engine is constrained.
Beyond investment flows, silver’s industrial demand—normally a stabilizer—also feels the impact of higher rates. Slower growth forecasts and higher financing costs can dampen expectations for manufacturing and technology demand, weakening the industrial case in the near term. Because both of silver’s engines respond to the same macro signals, it can fall harder when monetary policy risk increases.
Put simply: when rate-hike fears rise, the monetary engine weakens and the industrial engine often weakens too, leaving silver especially exposed.
What Does This Mean for Physical Silver Holders?
Price movements on COMEX reflect claims, margin mechanics and macro positioning; they can swing quickly on shifting rate expectations and technical flows. Today’s 2.36% drop was primarily a market-price response to those dynamics.
Physical silver held in vaults behaves differently. It does not have margin calls or algorithmic liquidation; a bar or coin weighs the same regardless of the paper price. The structural fundamentals that matter to physical holders did not change between the session high and the low.
Key structural metrics remain tight: the World Silver Survey 2026 projects a 46.3 million ounce deficit for the year, marking another year of net supply shortfall. Since 2021, available above-ground silver stocks have been drawn down by hundreds of millions of ounces, and COMEX registered stocks have declined sharply from their earlier peaks. Those supply-side realities were unchanged by intraday price noise.
For long-term holders, today’s session serves as a reminder of silver’s dual character: powerful secular drivers from both monetary and industrial demand, and near-term sensitivity to interest-rate expectations. The geopolitical news that eased oil and inflation expectations showed how quickly the industrial and monetary narratives can align; the FOMC outlook showed how quickly the monetary narrative can reassert itself. Both dynamics will continue to influence price volatility.
Stay On Top of Gold & Silver Prices
Get important market alerts delivered to your inbox.
Gold · Silver · Gold/Silver: Live price widget removed for static view
SOURCES
1. Federal Reserve — Summary of Economic Projections (Dot Plot), June 2026 (FOMC projections).
2. World Gold Council — Gold demand trends, Q1 2026 (gold demand analysis).
3. Silver Institute / Metals Focus — World Silver Survey 2026 (supply deficit and stocks analysis).
4. CME Group — COMEX silver registered stocks data (exchange inventory trends).
5. GoldSilver — Spot price data for gold and silver used for intraday pricing on June 18, 2026.
Disclaimer: This article is for informational purposes only and does not constitute financial or investment advice. Always consult a qualified financial adviser before making investment decisions.
You May Also Like:
- The Fed Went Silent. Gold Holders Don’t Need It to Speak.
- Five Signals That Say Gold’s Correction Is a Reset, Not a Reversal
- The Fed Just Killed Its Rate Roadmap. Here’s What That Means for Gold.
- Gold Holds at $4,347 While Stocks Hit All-Time Highs. Here’s Why.
- Why Is Silver Up Today? The Iran Deal Changed the Fed Math
- Gold Up 3%, Silver Up 4.7%: Five Forces Driving Metals Higher Today
- Iran Peace Deal Sends Oil Down 5%, Gold Up 3%
- Gold & Silver Surge on Iran Peace Deal — Then Pull Back
- Silver Fell 22% in 30 Days. Gold-Silver Ratio Hits 63.
Popular Topics
Picked from the archive
-
01
 Topics
Gold Price Drops From Peak as Central Banks Continue Buying
-
02
Topics
Gold’s Bull Run: Fed Rate Cuts and China Buying Drive $5K Target
-
03
Topics
Why China’s Silver Imports Soared to a Record in 2026
-
04
Topics
Silver Eagle vs Maple Leaf vs Britannia: Which Has More Silver?
-
05
Topics
Gold Drops 19%: $3.8B Investor Bet Says It Won’t Matter
-
06
Topics
Trump Putin Summit and Jackson Hole Threaten Stock Bull Run
-
07
Topics
Optimize Portfolio with the 80/60 Gold-Silver Rule
-
08
Topics
Why Investors Are Buying Gold After Today’s Price Drop