Gold-to-Silver Ratio Hits 64: What It Means for Silver in 2026
Key Takeaways
- The gold/silver ratio dropped from about 85:1 in late February to roughly 64:1 today — a 21-point compression in roughly five weeks.
- Historical precious metals bull cycles since 1980 show that ratio compression from elevated levels tends to precede periods when silver significantly outperforms gold.
- At around 64:1, the ratio sits near its long-run average (about 65–70:1). In past bull-market peaks it compressed much further — to about 31:1 in 2011 and to 17:1 in 1980.
- Silver is projected to be in its sixth consecutive year of supply deficit, with a 2026 shortfall estimated at 46.3 million ounces.
- The June 17 Fed dot plot pushed the ratio higher temporarily. Historically, such macro-driven moves tend to be noisy and often short-lived during this stage of a bull cycle.
Gold/Silver Ratio — January to June 2026
Ounces of silver required to purchase one ounce of gold
Source: LBMA spot prices | GoldSilver Price Charts
On January 29, 2026, silver reached an all-time high of $121.62 per ounce. At that peak, the gold/silver ratio — the number of ounces of silver required to buy one ounce of gold — tightened to about 50:1, its narrowest reading in decades.
Just one day later, markets reacted strongly to Kevin Warsh’s nomination as Federal Reserve Chair. Investors read the nomination as hawkish. Silver plunged roughly 30% in a single session, producing the metal’s worst single-day loss since 1980, and the ratio widened toward 85:1.
Over the following five weeks the ratio compressed back toward the mid-60s and today sits near 64:1. LBMA spot prices registered 61.1 on June 16 before a Fed-related dot-plot shift pushed the ratio a bit higher. That move — from 50 to 85 to about 64 — is the defining structural read on the precious metals complex right now. It does not predict short-term price moves, but it reveals how silver stands relative to gold and why the current setup matters.
How to Read the Gold/Silver Ratio — and Why 64:1 Matters Today
The gold/silver ratio equals the price of gold divided by the price of silver. With gold trading near $4,227 and silver close to $66.16, the ratio is roughly 64:1: it takes about 64 ounces of silver to buy a single ounce of gold.
A high ratio indicates silver is cheap relative to gold; a low ratio means silver is expensive relative to gold. The ratio is a relative valuation metric — it does not say whether either metal is cheap or expensive in absolute terms, only which one is outperforming the other.
Over the long run the ratio averages around 65–70:1. During major bull markets, however, the ratio has historically compressed well below that average. In 1980 it fell to about 17:1; in 2011 it tightened to roughly 31:1 before the silver cycle peaked. Historically, a reading like 64:1 has often been the starting point for a more aggressive compression phase rather than the end of it.
Why Did the Gold/Silver Ratio Fall So Sharply?
The move from 85:1 down into the low-60s over five weeks resulted from two primary catalysts that acted through the same mechanism.
First, a US‑Iran ceasefire announced on June 15 drove oil prices lower. Falling oil reduces inflation expectations, which in turn reduces the incentive for policymakers to raise rates. With rate expectations easing, real yields compress. Non-yielding assets like silver become more attractive versus yield-bearing alternatives.
Second, extreme positioning in markets unwound. At 85:1, markets had priced in a persistently hawkish Fed. Such extremes are rarely sustainable; markets tend to mean-revert and often overshoot while correcting. That unwinding helped drive silver’s relative rebound against gold.
Then, on June 17, the Fed’s dot plot — signaling several officials foreseeing potential rate hikes — briefly pushed the ratio back toward the mid-60s as both metals experienced some selling. That episode illustrates the short-term noise versus the longer-term structural signal.
What Does History Show When the Ratio Compresses From This Level?
Across the three major bull cycles since 1980, the pattern is instructive even if not predictive. In 1979–1980, stagflation, dollar weakness, and monetary stress pushed precious metals sharply higher, and silver outpaced gold dramatically; the ratio compressed from around 40:1 down to 17:1 at its extreme. In 2008–2011, gold gained first and silver followed, driving the ratio from near 80:1 to about 31:1 over roughly 30 months.
This cycle is unusual because the starting point for compression was higher — the ratio was 85:1 during a silver correction rather than at a bull market peak. Starting compression from a higher ratio means the potential ceiling for silver’s relative outperformance can be higher than in prior cycles. Still, these patterns unfold over months to years; they do not offer a timetable.
What Makes This Silver Cycle Different From 1980 and 2011?
The 1980 rally was heavily speculative and amplified by concentrated positions; the 2011 surge followed monetary stimulus after the financial crisis. Today, two distinct demand engines are active at the same time.
The monetary engine remains strong: persistent fiscal deficits, continued central bank buying of gold, and broader monetary pressures are supportive of precious metals. At the same time a structural industrial demand engine is present: silver has experienced multiple consecutive years of supply shortfalls. The World Silver Survey 2026 projects a 46.3 million ounce deficit for the year, and above-ground inventories have drawn down materially since 2021. Demand from solar panel manufacturers, data center and AI infrastructure, automotive electronics, and power transmission is structurally growing and less price-sensitive than other uses.
When both monetary and industrial demand drivers operate together, ratio compression can be sustained by real physical tightness as well as by speculative flows. That combination was not present in 1980 or in 2011 to the same extent; it is a key difference now.
What Does the Warsh Dot Plot Tell Silver Investors?
The June dot plot pushed silver down in the short term, which is logical: higher expected rates raise the opportunity cost of holding non-yielding assets. But notice the scale of the reaction. The move was modest compared with the January shock following Warsh’s nomination. Markets have already absorbed much of the policy surprise. That asymmetry suggests the structural bid for silver remains intact and that the recent sessions represent noise rather than a reversal of the cycle.
What Should Precious Metals Investors Watch Next?
Three developments will be decisive for whether the ratio continues compressing or stalls near current levels:
1. MOU implementation. The US‑Iran memorandum of understanding signed in mid‑June initiated a diplomatic window. If implementation holds and the Strait of Hormuz remains open, oil could normalize further, easing inflation expectations and lowering real yields — a favorable chain for silver. If the agreement breaks down, geopolitical risk and energy-driven inflation could reverse that dynamic.
2. Inflation trajectory. May’s CPI reading rose to 4.2% year-over-year, driven in large part by energy. If oil and energy costs fall as the diplomatic process progresses, near-term CPI readings could moderate, altering the Fed’s path and reducing the probability of rate hikes priced into markets.
3. Depth of the supply deficit. Ongoing physical inventory drawdowns and recovering retail investment — which industry estimates expect to grow materially — would create a supply-constrained floor for silver prices. Structural shortages are more durable than pure monetary speculation.
The gold/silver ratio is a useful tool for assessing relative value between the two metals, but it is not a trading signal on its own. At about 64:1, with the structural case for silver still intact and both monetary and industrial demand in play, history suggests this reading is more often a starting point for deeper compression than a terminal level. Careful investors should combine ratio analysis with supply, demand, and macro factors rather than relying solely on a single metric.
Physical gold and silver have preserved purchasing power across many monetary cycles; fiat currencies have not. Understanding how the ratio reflects relative value helps investors assess exposure and long-term financial sovereignty.
The Knowledge That Changes Everything
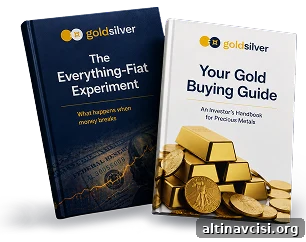
Two essential guides — free. Learn why gold matters and why fiat currencies are vulnerable.
Stay On Top of Gold & Silver Prices
Get important market alerts sent straight to your inbox.
SOURCES
1. Silver Institute, World Silver Survey 2026 (April 15, 2026) — silverinstitute.org
2. Silver Institute, Global Silver Investment to Remain Strong in 2026 Against the Backdrop of a Sixth Consecutive Annual Market Deficit (February 10, 2026) — silverinstitute.org
3. MacroTrends, Gold to Silver Ratio — 100 Year Historical Chart — macrotrends.net
4. CNBC, Silver plunges 30% in worst day since 1980, gold tumbles as Warsh pick eases Fed independence fear (January 30, 2026) — cnbc.com
5. Fox Business, June FOMC: Fed holds interest rates steady as Warsh era begins (June 17, 2026) — foxbusiness.com
6. U.S. Bureau of Labor Statistics, Consumer Price Index — May 2026 (June 10, 2026) — bls.gov
7. CME Group, FedWatch Tool (June 17, 2026) — cmegroup.com
8. Investing News Network, Silver Institute: Sustained Supply Deficit Exposes Market to Squeezes (April 27, 2026) — investingnews.com
Disclaimer: This article is for informational purposes only and does not constitute financial or investment advice. Always consult a qualified financial adviser before making investment decisions.
You may also like:
- How Central Banks Decide How Much Gold to Hold
- How Much Does Gold Storage Cost? The $72-a-Year Answer
- Silver Price Outlook June 2026: The Correction Was the Setup
- Central Bank Gold Purchases 2026: Unreported Demand
- Silver Eagle vs. Maple Leaf vs. Britannia: Which Gives You More Silver?
- Gold Price Outlook June 2026: What CPI and the Fed Mean
- How Gold Price Is Set: The East-West Tide Explained
- Does Physical Gold Have Counterparty Risk? The Facts
- Why Is Gold Still a Safe Haven? Switzerland’s Biggest Refiner Just Answered.
Popular Topics
Picked from the archive
-
01
 Topics
What the Fed’s 3-Day Silence Means for Gold Prices
-
02
Topics
Gold Jumps to $4,746 as Oil Crashes: Why Investors Are Bullish
-
03
Topics
How Government Debt Drives Gold and Silver Prices
-
04
Topics
Can Gold Hold at $4,300? Price Outlook for Investors
-
05
Topics
Why Gold and Oil Move Opposite and What It Means for Investors
-
06
Topics
Gold and Silver Prices: Short-Term Volatility, Long-Term Trend
-
07
Topics
Wholesale Prices Jump Most in 3 Years as Tariffs Hurt US Economy
-
08
Topics
Why Silver Jumped 6% Before Trump Xi Summit