Gold Jumps to $4,746 as Oil Crashes: Why Investors Are Bullish
Gold and silver market update — May 7, 2026
In today’s update: Gold climbed to $4,746 and silver surged 5% on May 7, 2026, after developments in US‑Iran peace talks pushed oil lower, Berkshire Hathaway disclosed a record cash balance, and the gold/silver ratio tightened to 58 — indicating silver is now leading the move.
On May 7, 2026, spot gold reached $4,746.19 (+1.14%) while silver jumped to $81.30 (+5.01%). Both metals rose the same day oil dropped roughly 7% and equity markets pressed toward record highs. The gold/silver ratio compressed to 58.38. When risk assets rally and precious metals advance with them, the market appears to be adjusting to a structural shift rather than reacting to a short-term event. Below are five key developments explaining why gold is rising today — and what each one means for investors.
Why Is Gold Rising While Oil Falls and Stocks Rally?
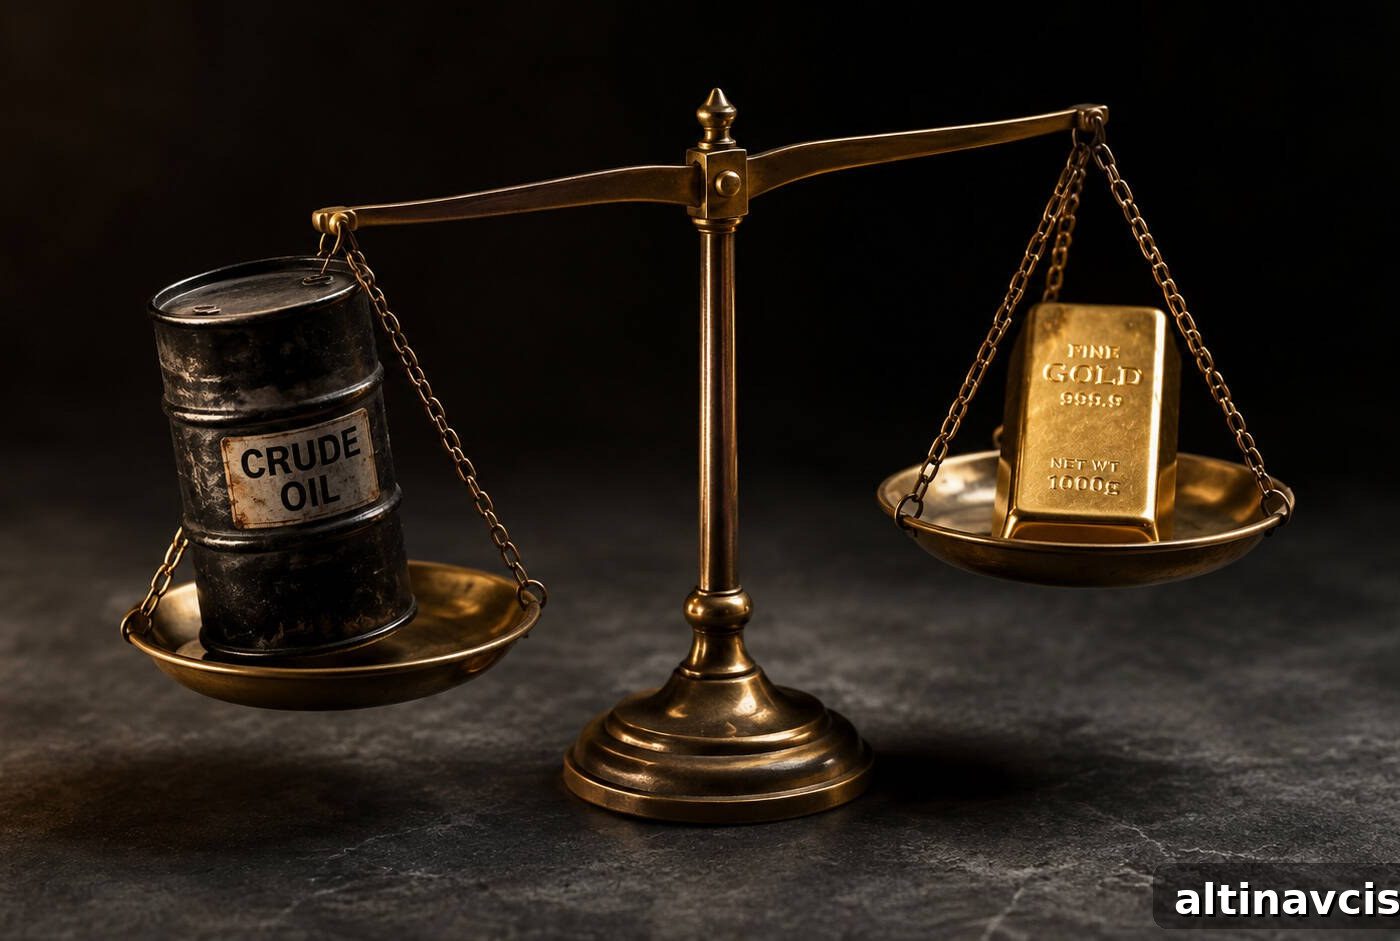
Gold’s rise this session is closely tied to falling oil prices, which reduce inflationary pressure and ease the outlook for interest rates. The immediate catalyst was a one‑page US peace framework sent to Iran via Pakistani mediators, an initiative aimed at ending the 68‑day conflict and reopening the Strait of Hormuz. Oil declined nearly 7% over two sessions, trading in the mid‑$90s. Lower energy costs tend to relieve inflation pressures, which in turn lowers expectations for further central bank rate hikes and pushes Treasury yields down. Because gold performs well when real yields fall, the chain from peace talks to lower oil to reduced rate expectations is the primary force behind today’s gains. As analysts have pointed out, a peace agreement would not end the metals’ rally; it would likely accelerate the timeline for potential rate cuts that support both gold and silver.
The Edge Every Investor Needs
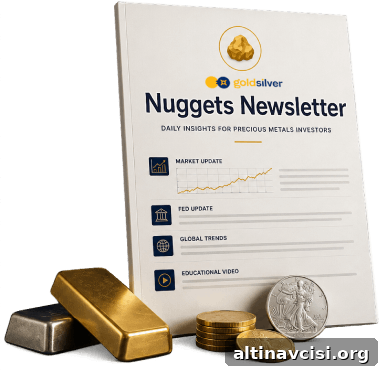
Smarter precious metals investing starts here. The Nuggets Newsletter provides concise market analysis, Fed updates, global trends, and educational resources to help investors stay informed.
Why Is Berkshire Hathaway Sitting on $397 Billion in Cash?
Berkshire Hathaway finished Q1 2026 with a record cash balance of $397.4 billion, up from $373 billion at the end of 2025. Greg Abel succeeded Warren Buffett as CEO on January 1, 2026, and told shareholders at the May 2 annual meeting that the large cash reserve gives the company flexibility in an uncertain market. Abel emphasized he will not deploy the cash merely for the sake of deploying it. That cautious approach mirrors a common rationale among gold holders: avoid overpaying for assets, keep dry powder, and wait for compelling opportunities. The tools differ, but the underlying discipline is the same.
What Does the US Credit Rating Downgrade Mean for Gold?
For the first time in more than a century, the United States does not hold a top rating from all major credit agencies. Moody’s reduced the US sovereign rating to Aa1 from Aaa in May 2025, joining earlier actions by other agencies. The downgrade reflects long-term fiscal pressures: federal debt projections and sharply rising interest costs are weighing on the outlook. With total national debt near $39 trillion as of April 2026 and interest payments expected to rise significantly over the coming decade, investors increasingly price this fiscal risk into safe-haven assets. Gold had already been reacting to these structural budgetary trends; the downgrade reinforced that dynamic and remains one reason gold is trading near record levels.
Why Does the US-UK Trade Deal Matter for Silver Prices?
The US‑UK Economic Prosperity Deal reduced tariffs on UK steel and aluminum entering the US and marked a move toward easing transatlantic trade frictions. For silver, the link is industrial demand: roughly 60–61% of annual silver consumption is industrial, according to the World Silver Survey 2026. Tariff barriers had constrained manufacturing output on both sides of the Atlantic since last spring. A trade agreement can lift that restraint, increasing industrial activity and demand for silver in an already tight market. Silver is in its sixth consecutive year of structural supply shortfalls, so even modest increases in industrial demand can translate into outsized price moves. Today’s 5% jump in silver may be an early indication of that adjustment.
What Does a Gold/Silver Ratio of 58 Signal for Investors?
The gold/silver ratio fell to 58.38 on May 7, 2026, as silver surged 5% compared with a 1% gain in gold. Historically, sharp declines in the ratio have preceded some of silver’s strongest multi‑month rallies. A rapid drop in a single session suggests a structural rebalancing rather than mere noise. Market strategists have noted that supply deficits, combined with easing inflation expectations and supportive momentum, could push both metals toward new highs. In this environment, silver appears to be taking the lead, narrowing the ratio and signaling potential further upside for industrially driven precious metals.
Watch: Iran’s response to the US framework is expected within days. A confirmed deal would likely push oil lower, further ease inflationary pressure, and add momentum to both gold and silver. Near-term technical resistance for gold sits around $4,850, while silver faces resistance near $85.
Prices as of May 7, 2026 ET: Gold $4,746.19 (+1.14%) · Silver $81.30 (+5.01%) · Gold/Silver Ratio 58.38 (–3.68%)
Stay On Top of Gold & Silver Prices
Receive timely market alerts and concise analysis directly to your inbox.
SOURCES
1. GoldSilver.com — Live Gold Price Chart
2. GoldSilver.com — Live Silver Price Chart
3. CNBC — Gold climbs to two-week high as US‑Iran peace hopes push oil lower
4. CNBC — Gold and silver’s historic rally could resume ‘as fog of war lifts’, market watchers say
5. AP via US News — Berkshire Hathaway’s new CEO Greg Abel opened the first annual meeting without Warren Buffett
6. CNBC — Berkshire Hathaway annual meeting 2026: Live updates
7. Moody’s Ratings — 2025 United States Sovereign Rating Action
8. Moody’s Ratings — Downgrade of United States to Aa1, May 16, 2025
9. Wikipedia — United States federal government credit‑rating downgrades
10. Peter G. Peterson Foundation — The Current Federal Deficit and Debt (CBO data)
11. US Department of the Treasury — Debt to the Penny
12. The Silver Institute — World Silver Survey 2026: Supply and Demand
13. Al Jazeera — US and UK announce trade framework deal
Disclaimer: This article is for informational purposes only and does not constitute financial or investment advice. Consult a qualified financial adviser before making investment decisions.
You May Also Like:
- Gold Price and Nonfarm Payrolls: Why the Fed Is Trapped
- Gold Is Decoupling From Geopolitics. Here’s the Proof
- The Fed Is Frozen. The Debt Is Growing. Gold Is Watching.
- Gold Jumps on Iran Deal Hopes. The Real Driver Is the Fed
- What the IMF’s Inflation Forecast Shift Means for Gold
- What’s Really Driving Gold Prices Today — 5 Key Signals
- Gold Price and the Jobs Report: A Pre‑Market Guide
- The Gold‑Silver Ratio Is Expanding — and Being Misread
Popular Topics
Picked from the archive
-
01
 Topics
Tariffs Boost Gold Prices Despite Weekly Drop Ahead of US Jobs
-
02
Topics
Could Trump’s Trade Wars End a Century of US Dollar Dominance?
-
03
Topics
Gold Tops $5,300 as Fed Meeting Sends Dollar Tumbling
-
04
Topics
Gold vs Silver: Which Metal Fits Your Portfolio?
-
05
Topics
Gold Prices Rise as Dollar Slips Ahead of Fed Rate Decision
-
06
Topics
How to Allocate Gold Between Stocks and Bonds
-
07
Topics
Gold Weekly: $9T Swing, Trump Fed Nominee, Record Premiums
-
08
Topics
Digital vs Physical Gold: What Do You Really Own?