BEA Removed Silver From GDP: What It Means

Gold and silver market update — April 30, 2026
Key Takeaways
- The Bureau of Economic Analysis (BEA) again removed investment silver from the GDP trade data for the third consecutive quarter — a sign that physical silver flows now affect official trade statistics.
- COMEX registered silver has stayed below the 15% coverage-ratio stress threshold for six months. First Notice Day passed quietly today, but the registered inventory level in the coming days is the critical metric to watch.
- The paper price ($73.68 on April 30, 2026) and the physical market are sending different messages. The BEA note, COMEX inventory dynamics, and a 762 million ounce decline in above-ground stocks are three independent indicators pointing to the same underlying trend.
On April 30, the BEA released its advance estimate for first-quarter 2026 GDP. The headline — 2.0% annualized growth, slightly below the 2.2% consensus — pushed the dollar lower and drove gold back above $4,600 per ounce. Silver rose by 3.32% to $73.68.
Beyond the headline numbers, the report included a notable accounting adjustment: the BEA again identified and removed investment silver bar exports from the national accounts. That adjustment indicates that physical silver movements were large enough to distort trade data, and the BEA treated them as investment flows rather than standard commodity trade. This is an institutional acknowledgement that silver is acting like a monetary asset in meaningful volumes right now.
Why Does the BEA Remove Silver From GDP Data?
Gross Domestic Product measures production and final demand; it does not count purchases of investment assets as output. Buying a gold or silver bar does not create new goods or services — it reallocates wealth. When large quantities of physical silver cross national borders, the Census Bureau records them as trade flows. The BEA must then decide whether those flows are industrial trade (which belongs in GDP) or investment flows that should be excluded.
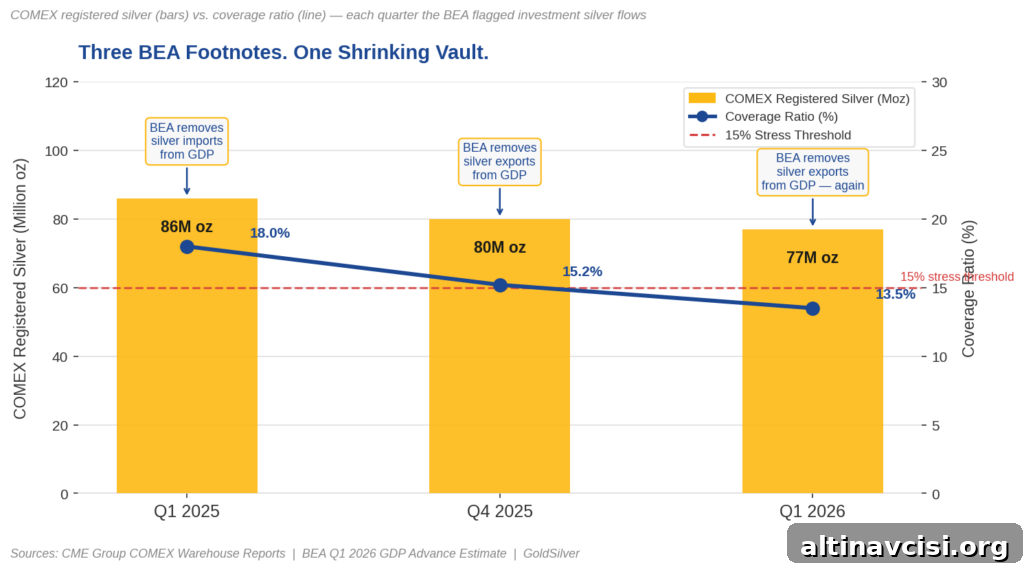
Over the past three quarterly reports the BEA has reached the same conclusion: treat these large silver bar movements as investment flows and remove them from GDP. The sequence of events looks like this:
- Q1 2025 (imports): Unusually large volumes of silver entered U.S. vaults.
- Q4 2025 (exports): Silver bar exports were flagged as investment flows and stripped from GDP.
- Q1 2026 (exports): The BEA applied the same adjustment again in the latest advance estimate.
Repeated removal of investment silver from GDP is not a routine technicality. It signals a structural shift in how large market participants are using silver — increasingly as a store of value rather than as a purely industrial input.

The Edge Every Investor Needs
Smarter precious metals investing begins with informed, timely analysis. Receive curated market insights, policy updates, and educational content geared toward thoughtful investors.
What Is the COMEX Coverage Ratio — and Why Does It Matter Today?
First Notice Day for May COMEX silver contracts coincided with the BEA GDP release at 8:30 a.m. ET. First Notice Day is the first date on which futures holders may be required to accept delivery of physical metal; holders must either close positions, roll them forward, or be prepared to receive delivery.
The COMEX coverage ratio compares registered, deliverable silver in approved warehouses to the number of outstanding paper silver contracts. When that ratio falls below roughly 15%, the market is considered to be in stress because paper claims significantly outnumber warehoused physical metal. As of April 27, there were 134.8 million ounces of May contracts open, while only about 75–77 million ounces of registered silver were available — a coverage ratio near 13–14% (CME Group data). Crucially, that ratio has remained below the stress threshold for six consecutive months.
Most May positions rolled into July as expected on First Notice Day, and the delivery count on the day tended to be routine. The important signal to watch now is whether registered inventory holds steady or continues to decline in the coming days. A shrinking registered pool would reinforce the narrative that physical silver demand is outpacing the supply available for delivery.
Has Silver Crossed the Line From Industrial Metal to Monetary Metal?
Gold has long been treated as both an industrial input and a monetary asset; BEA accountants routinely exclude nonmonetary gold investment flows from GDP. Silver historically behaved differently, primarily as an industrial metal priced on supply, demand and inventory cycles. That appears to be changing.
The BEA’s repeated footnote treating silver bar exports as investment flows is an institutional recognition that silver is now moving in volumes and for reasons more akin to monetary metal than industrial commodity. This distinction matters for how prices form: industrial metals track production and consumption fundamentals; monetary metals reflect confidence in paper alternatives and a desire to store value in physical form.
When a government statistical agency flags investment silver across multiple reports, it is quietly documenting a shift in market behavior and in the way large holders allocate capital.
What Did the Financial Press Miss in Today’s GDP Report?
Most headlines focused on the 2.0% GDP print and its implications for interest-rate timing, recession odds, and sectoral trade effects. Few commentators noted the BEA’s brief but significant silver footnote. The BEA wrote that it “identified and removed an increase in exports of silver bars used as a form of investment in the first quarter.”
Seen in context — three consecutive quarters of adjustments, a persistent COMEX coverage ratio below 15%, and silver up over 127% year over year — that dry administrative note reads much more clearly as evidence of rising physical demand and an erosion of trust in paper substitutes among some investors.
What Does This Mean for You?
No single data point should dictate portfolio decisions. Still, three converging facts deserve attention:
- Large institutions, sovereign entities, and funds have been taking physical delivery of silver at a sustained, high rate for fifteen consecutive months according to COMEX warehouse reports.
- Global above-ground silver inventories have been reduced by approximately 762 million ounces over five consecutive deficit years, per industry surveys and supply estimates.
- The BEA has flagged investment silver flows in three consecutive GDP releases, formally removing those flows from the national accounts.
Taken together, these points describe a market where physical demand and inventory depletion are meaningful and persistent. The futures price ($73.68 on April 30, 2026) reflects paper market dynamics, but the physical market and institutional allocation choices tell a deeper story about scarcity and confidence.
How Are Major Institutions Responding?
Institutional behavior offers useful context. Central banks have been active in the gold market, and investment firms and funds have increased allocations to physical silver products. For example, some major bullion trusts expanded their capital-raising programs in early 2026. These moves are not fringe activity; they represent large, deliberate shifts toward physical holdings by entities that can move markets.
This is not a forecast or alarmist rhetoric — it is an interpretation of official data, market flows, and inventory trends. Reading the footnotes and warehouse numbers alongside futures pricing gives a fuller picture of market dynamics.
Stay On Top of Gold & Silver Prices
Receive timely market alerts and analysis delivered to your inbox.
SOURCES
1. Bureau of Economic Analysis — GDP Advance Estimate, 1st Quarter 2026 (BEA release)
2. U.S. BEA — GDP Advance Estimate, 4th Quarter and Year 2025
3. U.S. BEA — Gross Domestic Product Data Archive (Q1 2025)
4. CME Group — COMEX silver warehouse stocks and delivery notices
5. Silver Institute / Metals Focus — World Silver Survey 2026
6. Sprott Asset Management — Sprott Physical Silver Trust updates (public announcements)
7. Trading Economics — Silver spot price, April 30, 2026
Disclaimer: This article is for informational purposes only and does not constitute financial or investment advice. Consult a qualified financial adviser before making investment decisions.
You May Also Like:
- PCE at 3.5%, GDP Miss: Why This Is Bullish for Gold
- How New Inflation Measures Could Move the Gold Price
- Gold Is Down 19%. What Large Investors Are Saying
- Gold, Oil, and the Fed: Why Historical Relationships Are Shifting
- Why Some Countries Adjust Their Gold Reserves — Lessons on Sound Money
- Why Gold Responds Predictably to Geopolitical Tension
- Oil, OPEC Dynamics, and Precious Metals: What to Watch
- How Global Policy Can Restrict Silver Supply Without Direct Intervention
- Central Bank Communication: What It Means for Gold
Popular Topics
Picked from the archive
-
01
 Topics
Gold Pauses at $3,357 After Rally as Bulls Target $3,500
-
02
Topics
Gold Rises Amid Fed Uncertainty, Weak Jobs and Crypto Turmoil
-
03
Topics
Powell’s Jackson Hole Speech Could Tip the Stock Rally
-
04
Topics
US-EU Deal Sets 15% Tariffs; China Truce to Continue
-
05
Topics
Gold vs. Stocks 2026: Q1 Returns Investors Need to Know
-
06
Topics
Powell Signals Fed Rate Cut in September as Jobs Weaken
-
07
Topics
Why Gold Hit $5,100: What’s Driving the Rally Next
-
08
Topics
Gold Prices Hold as Fed Faces Tough Interest Rate Decision