Gold vs. Stocks 2026: Q1 Returns Investors Need to Know
The first quarter of 2026 closed with a clear message from markets: energy prices surged, equities weakened, and gold—despite a late-week decline—largely held its ground. Year-to-date returns across major asset classes, from crude oil to the NASDAQ and Bitcoin, reflect a striking rotation in market leadership as geopolitical risk pushed energy costs sharply higher.
Positive return
Negative return
Gold
Why Did Oil Prices Surge So Dramatically in Q1 2026?
The most dramatic figure in recent market data is oil’s year-to-date gain—about 73.5% as of March 27, 2026. That spike reflects a direct economic impact from the Middle East conflict: supply disruptions, constrained shipping routes and heightened geopolitical uncertainty all combined to push Brent crude sharply higher over the quarter. These energy-market stresses rippled across other commodity prices and reshaped investor expectations for inflation and growth.
The broader commodity complex advanced substantially as well, with the Bloomberg Commodity Index rising more than 22% year-to-date. Together, these moves represent an energy shock large enough to alter macro forecasts and market positioning, creating renewed stagflation concerns as policymakers and investors weigh how long higher energy prices will persist.
How Are Equity Markets Responding to Rising Energy Prices?
Higher energy costs do not remain confined to the energy sector. They raise input costs for companies, lift inflation expectations, and dent consumer confidence—forces that all showed up in equity markets during Q1. Major indexes lagged: the NASDAQ dropped roughly 9.9% year-to-date and the S&P 500 declined about 7.0%. Some markets were hit harder—India’s Sensex fell the most among large indices—while risk-sensitive assets such as Bitcoin fell sharply, underscoring a broader retreat in risk appetite.
Early indicators reinforced the cautious tone. Composite PMI readings slowed, and consumer sentiment and near-term inflation expectations moved in directions consistent with an energy-driven slowdown. Those signals help explain why equity markets rotated away from earlier winners and why the outlook for corporate earnings and discretionary spending grew more uncertain.
Is Gold Still a Safe Haven with Yields Rising?
Gold’s year-to-date gain of about 3.1% may look modest beside oil’s large advance, but context matters. The LBMA weekly close showed gold pulling back modestly into the week ending March 27, yet it remained above key technical supports. That resilience came despite higher inflation expectations and a market-wide sell-off that prompted some profit-taking in gold as investors covered losses elsewhere.
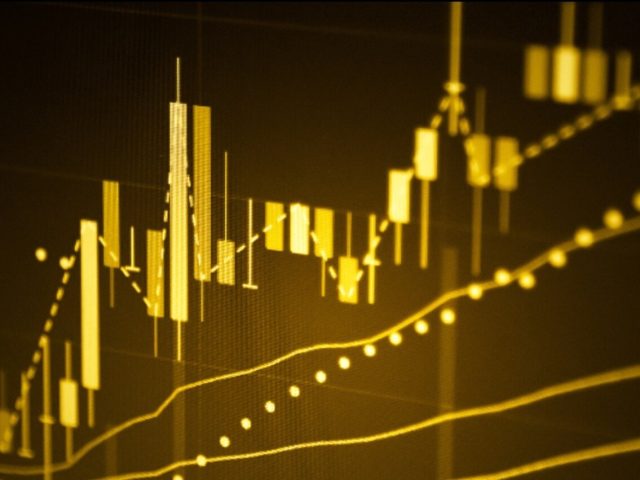
Critically, gold held long-term technical levels such as the 200‑day moving average and a meaningful Fibonacci retracement from its multi-year uptrend. Holding those levels through a period of heightened selling pressure signals that underlying demand—both investment and strategic central-bank demand—remains an important anchor for the metal.
What Does Stagflation Mean for Gold Going Forward?
Stagflation—slower growth paired with persistent inflation—is the outcome investors fear most because conventional policy tools can worsen one leg of the problem while addressing the other. In that environment equities suffer from weaker earnings and higher discount rates, while bonds lose real value as inflation eats into returns. Historically, gold has been one of the few assets to perform well in stagflationary conditions because it offers a real‑asset hedge and carries no counterparty risk.
If labor market readings weaken while energy-driven inflation remains elevated, stagflation risk moves from theoretical to practical. Central bank behavior adds nuance: occasional gold sales or swap operations make headlines, but strategic motivations for central-bank gold holdings generally persist. Against a backdrop of geopolitical stress and energy disruption, those strategic motives are more likely to reinforce, not reverse, demand for gold.
Your Gold Buying GuideMost investors overpay when they buy gold. Then overpay again when they sell. This guide explains what to own and why.
Request the guide or sign up to receive market updates and practical guidance on owning physical gold and related investments. (Form and subscription tools removed from this version.)
Stay On Top of Gold & Silver Prices
Get important market alerts delivered to your inbox.
People Also Ask
Why did oil prices rise so much in early 2026?
Oil’s large year-to-date rise through March 27, 2026—driven primarily by conflict-related supply fears and shipping disruptions—pushed commodity prices broadly higher. The energy shock fed into inflation expectations and increased the probability of persistent price pressure, raising stagflation concerns as a result.
How did gold perform compared to stocks in Q1 2026?
Gold produced a modest positive return year-to-date (~+3.1%) while major equity indices fell substantially (S&P 500 down ~7.0%, NASDAQ down ~9.9%). That relative stability is consistent with gold’s historic role as a portfolio diversifier during periods of heightened market stress.
What is stagflation and why is it bad for stocks but good for gold?
Stagflation combines slowing growth with persistent inflation. Equities suffer from weaker earnings and higher discount rates, while bonds are eroded by inflation. Gold has historically been a strong performer in stagflationary regimes because it is a real asset not tied to counterparty risk and often benefits from rising inflation expectations.
Is now a good time to buy gold given the market uncertainty?
Gold experienced a pullback in late March but held key long-term technical support levels—notably the 200‑day moving average and a key Fibonacci retracement zone near the $4,075–$4,113 range. Analysts view the support hold as meaningful, balanced against short‑term volatility and constructive medium‑term fundamentals such as stagflation risk and central‑bank demand. As always, individual suitability depends on personal financial circumstances and investment objectives.
Sources
- World Gold Council — Weekly Markets Monitor: Conflict Pressure Mounts (March 2026). Primary source for asset-class return data, gold price and ETF flows.
- Bloomberg — underlying price and return data for commodity and equity indices (via WGC data aggregation).
- S&P Global Market Intelligence — US flash PMI and related economic indicators (March 2026).
- University of Michigan — Surveys of Consumers (March 2026) for consumer sentiment and inflation expectations.
- ICE Benchmark Administration / LBMA — LBMA Gold Price PM, used as a benchmark for the weekly gold close.
- World Gold Council research and outlook publications referenced for medium-term scenario context and historical analysis.
This article is for informational purposes only and does not constitute financial or investment advice. Consult a qualified financial advisor before making investment decisions.
You May Also Like:
- Is a Policy Reversal Coming? What the Conflict Pressure Index Means for Gold
- Gold ETFs Are Booming. But Do You Actually Own Gold?
- Silver Demand by Sector: Industry, Jewelry & Investment
- Small Market, Big Swings: Why Silver Is More Volatile Than Gold
- Is Now a Good Time to Swap Silver for Gold?
- Should I Buy Gold Now? What Most Investors Get Wrong
- Dollar Devaluation Since 1971: Why Central Banks Keep Buying Gold
- How to Roll Over Your 401(k) Into a Gold IRA
Popular Topics
Picked from the archive
-
01
 Topics
Gold Price Rebounds Amid Iran Tensions, Fed Moves, Dollar Surge
-
02
Topics
4 Trillion AI Milestone Sparks Valuation Concerns
-
03
Topics
Dollar Surges as Trump Threatens Tariffs on Copper and Chips
-
04
Topics
Gold Prices 2025: How Economic Shifts Could Drive the Rally
-
05
Topics
Trump Push for 1% Fed Rate Fuels Inflation, Credibility Concerns
-
06
Topics
Dollar Drops as Markets Price In Fed Cuts; Tariff Fears Rise
-
07
Topics
Why CME Margin Hikes Sparked the Silver Crash
-
08
Topics
Gold Climbs as Mild Inflation Boosts September Rate Cut Odds