WGC Q1 2026: Asian Insights Wall Street Overlooks
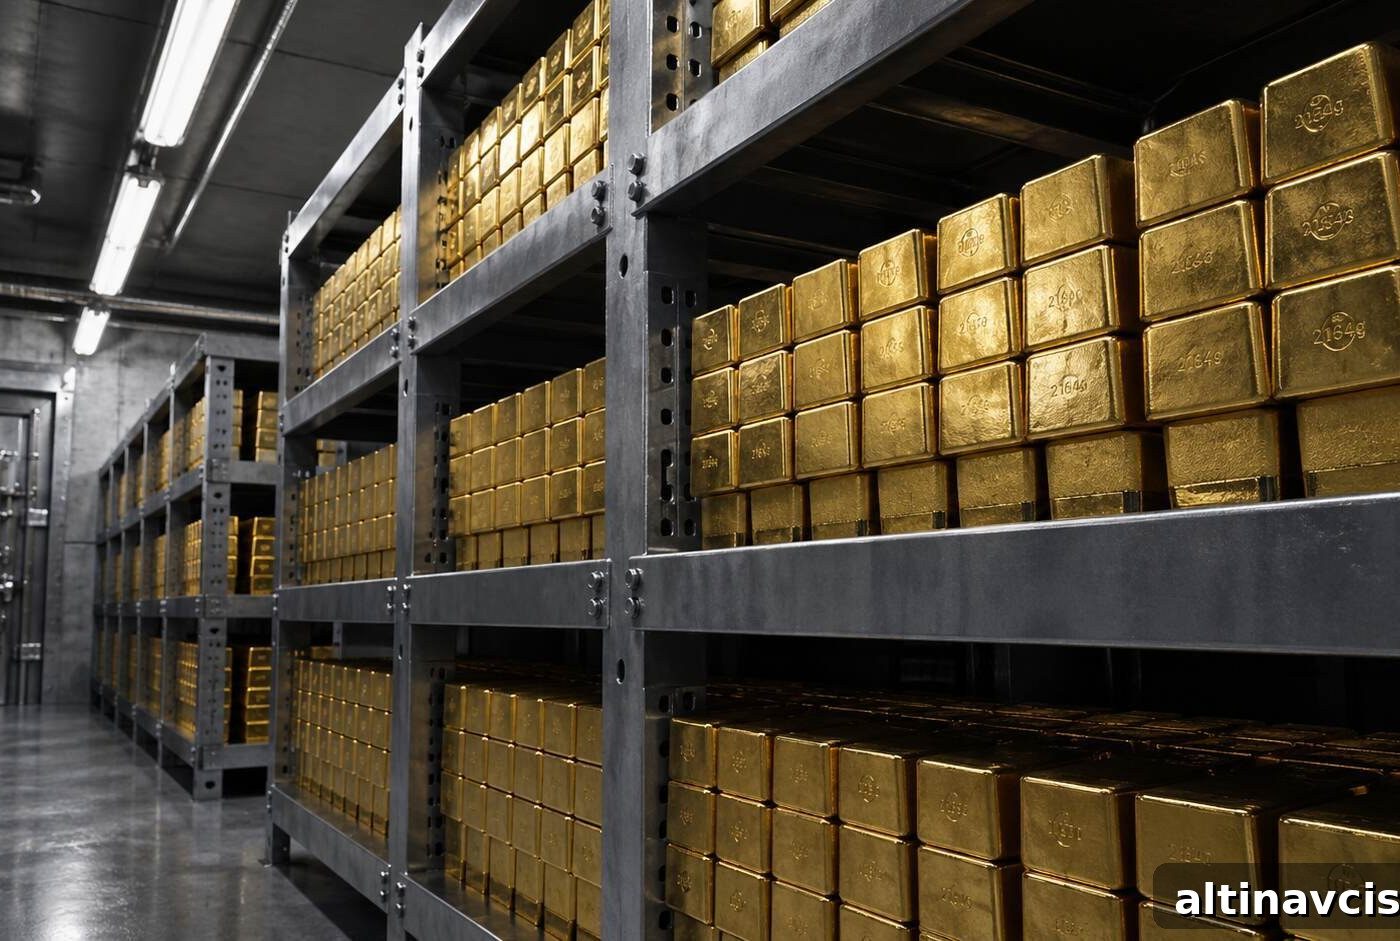
Gold and silver market update — May 1, 2026
Key Takeaways
- Asian retail investors pushed bar and coin demand to 474 tonnes in Q1 2026 — a 42% increase year‑over‑year and the second‑largest quarterly total on record — while US-listed gold ETFs reported net outflows in March.
- Central banks added a net 244 tonnes of gold in Q1 2026, extending a streak of seventeen consecutive months of net purchases, even as prices traded well above year‑ago levels.
- The split between physical buying in Asia and paper selling in the West marks a notable divergence that, historically, has signaled structural turning points in the gold market.
Global physical gold demand reached 474 tonnes in Q1 2026, the second‑highest quarter recorded, and it did so at prices near all‑time highs. The World Gold Council’s Q1 2026 Gold Demand Trends report, published April 29, highlights a clear regional split: strong retail demand in Asia contrasted with outflows from US ETFs in March. That pattern reflects differing investment time horizons and priorities.
Buyers of physical gold were not necessarily momentum traders. Many were buying to hold an asset outside the financial system amid persistent inflation — headline PCE printed at 4.5% annualized in Q1 2026 and core PCE at 4.3% — and a Federal Reserve signaling no immediate path to rate cuts. As of May 1, 2026, gold traded around $4,600 per ounce, down roughly $775 from January’s intraday peak near $5,405. Despite the pullback, physical demand remained robust.
Who Was Buying Gold in Q1 2026 — and Who Wasn’t?
Asian retail investors — notably in China, India and Southeast Asia — drove bar and coin demand to 474 tonnes in Q1, up 42% year‑over‑year. Bar demand alone reached 397.7 tonnes, the largest single quarterly total recorded in the bar data series. These purchases reflect retail appetite for physical metal as a store of value.
By contrast, US‑listed gold ETFs saw meaningful redemptions in March that erased inflows from January and February. Western institutional and ETF investors are more sensitive to short‑term real yields. With the 10‑year Treasury real yield near 1.96% at the end of April, bonds offered an attractive yield relative to non‑yielding gold, prompting some portfolio rebalancing away from paper gold.
Physical Buyers vs. Paper Sellers: Q1 2026 Snapshot
Global bar & coin demand surged while US ETF flows moved in the opposite direction in March. This split highlights distinct investor objectives across regions.
Global Bar & Coin Demand — 474t (Q1 2026)
US Gold ETF Net Flows — Net outflows in March (Q1 2026)
Physical bar & coin demand reached 474 tonnes — up 42% year‑over‑year and the second‑largest quarter on record — while US ETF investors recorded net outflows in March.
Why Are Eastern and Western Investors Reading Gold So Differently?
Western ETF managers and institutional investors tend to use a real‑yield framework: how does gold perform relative to a Treasury paying real yield? With the 10‑year real yield around 1.96% at the end of April, bonds provide a positive carry that creates a near‑term headwind for non‑yielding gold. That calculation often governs tactical decisions and quarterly flows.
Asian retail buyers, by contrast, focus on long‑term purchasing power: what will an ounce of gold buy in a decade? With inflation measured by PCE running above 4% and central banks signaling sustained restrictive policy, preserving purchasing power becomes the dominant consideration. Those buyers are prepared to hold through short‑term yield cycles.
What Are Major Institutions Forecasting for Gold in 2026?
Central bank purchases remain a structural underpin. Net central bank buying totaled 244 tonnes in Q1 2026, up modestly year‑over‑year and continuing a multi‑quarter trend. Central banks accumulate gold as a long‑term reserve asset; their behavior is not driven by quarterly price swings.
Major banks also publish price targets and demand models. For example, Goldman Sachs maintained a year‑end 2026 gold target of $5,400 per ounce in late April while noting short‑term downside risks. Some institutions are cautious tactically, but their central bank demand forecasts still model steady monthly accumulation across the year.
What Does the Demand Divergence Actually Signal?
Gold’s correction from roughly $5,405 to about $4,600 highlighted two stories at once. The price pullback dominated headlines, but an equally important development was the scale of physical buying during the drop. Retail buyers and some institutional buyers absorbed near‑record volumes, demonstrating durable demand even after a sharp rally.
Q1 demand value reached about $193 billion, a large increase driven mainly by price, while volume rose only modestly and mine production expanded by only about 2% to 1,231 tonnes. Mining cannot rapidly increase supply to match short‑term price moves, so the supply‑demand balance remains relevant for medium‑term price discovery.
What Should Gold Investors Watch in May 2026?
Three calendar items matter in May. First, the World Gold Council’s monthly ETF flows update (mid‑May) will show whether US ETF outflows in March reversed as prices recovered. Second, updated central bank flow estimates for March and April will clarify whether month‑to‑month accumulation returned to earlier levels. A recovery toward roughly 60 tonnes per month would remove the one soft signal from Q1.
Third, the US April Non‑Farm Payrolls report (released May 8) will influence the rate‑cut debate. A weak payroll print could reopen discussions of easing, compress real yields, and narrow the gap between short‑term, yield‑sensitive Western models and the longer‑horizon purchasing‑power approach prevalent among many Asian buyers.
SOURCES
1. World Gold Council — Gold Demand Trends Q1 2026 (Gold Demand Trends report)
2. Federal Reserve Economic Data (FRED) — 10‑Year Real Yield (DFII10)
3. Bureau of Economic Analysis — PCE and GDP advance estimates (Q1 2026)
4. Industry commentary and bank research published late April 2026 (Goldman Sachs coverage)
5. Market price data and commodity price services (gold price series, April–May 2026)
Disclaimer: This article is for informational purposes only and does not constitute financial or investment advice. Consult a qualified financial adviser before making investment decisions.
You May Also Like:
- BEA Stripped Silver From GDP. Here’s What It Means
- PCE at 3.5%, GDP Miss: Why This Is Bullish for Gold
- How Warsh’s Inflation Measure Could Move the Gold Price
- Gold Is Down 19%. This $3.8B Bet Says It Doesn’t Matter
- Gold, Oil, and the Fed: Why the Old Rules Don’t Apply
- Why Turkey Sold Its Gold Reserves — And What It Proves About Sound Money
- Why Gold Spikes Every Time Hormuz Opens — And Why It Never Holds
- Oil Hits $100 and OPEC Is Fracturing. Gold Knows Why
- How China Restricts Silver Supply Without Touching Silver

The Edge Every Investor NeedsSmarter precious metals investing starts here. Subscribe for concise market insights, Fed updates, global demand trends and practical education.
Popular Topics
Picked from the archive
-
01
 Topics
Gold Prices Rise on Fed Policy, Debt Concerns and Asian Demand
-
02
Topics
How Gold and Silver Reduce Losses and Boost Portfolio Returns
-
03
Topics
U.S. Eyes Pakistan’s $6T Mineral Wealth in Economic Partnership
-
04
Topics
Silver Price Forecast 2026-2027: Bull and Bear Scenarios
-
05
Topics
Gold Price Surges Past $5,000 Amid Bond Market Turmoil
-
06
Topics
Paper Gold vs Physical Gold: Safety and Investment Risks
-
07
Topics
Record Gold Floods Shanghai as Traders Exploit Futures Arbitrage
-
08
Topics
Gold Price: What Could Drive It to $6,300?