Gold Drops at Open as China Buys the Dip Again

Gold briefly reached a two-month high near $4,435 this morning before profit-taking nudged the price back toward $4,399. That pullback was short-lived: Chinese institutional investors stepped in quickly and absorbed most of the selling, restoring momentum within hours.
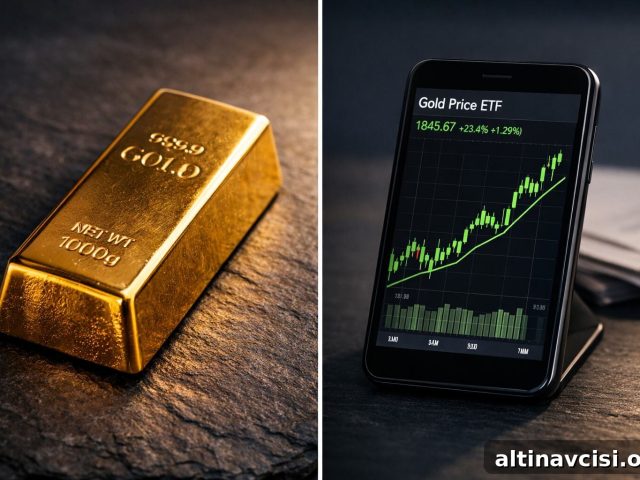
Chinese domestic gold ETFs recorded inflows for 14 consecutive trading sessions through Monday. Bloomberg confirmed this is the longest such streak since March, and those inflows totaled more than $1.2 billion, with one single-day injection reaching $370 million. This buying streak reverses the dramatic outflows seen in June, when Asian funds shed $2.3 billion — the largest monthly outflow on record for the region.
This behavior is not a fleeting sentiment shift. It is an institutional rotation: large allocators are moving capital out of underperforming domestic equities and into gold, a deep, liquid asset with no counterparty risk. Understanding that rotation explains more about gold’s structural price floor than short-term technical charts do.
Why Are Chinese Institutional Investors Buying Gold Right Now?
Chinese equities suffered sharply in July. The broad CSI 300 index fell roughly 10% — its worst monthly decline in a decade — while tech-heavy benchmarks plunged even more as investors rotated away from crowded AI positions. When a concentrated equity bet unravels, institutional allocators need a large, liquid alternative that can absorb substantial capital. Gold fits that need: it offers deep liquidity, global market access, and no counterparty exposure.
Gold also traded down about 21% from its January record high before the recent rebound, which made it look like a discounted entry for institutions seeking stability and liquidity. Earlier in the year, Chinese gold ETF inflows reached $8.1 billion through April even as U.S. gold ETFs saw outflows over the same period — identical assets but divergent flows across two major markets. That pattern reversed in June as equities recovered and profit-taking returned; now July’s equity weakness has triggered a renewed rotation into gold.
At the same time, the People’s Bank of China has been adding to its official gold reserves for more than a year and a half of consecutive months. Official reserve accumulation establishes one supportive baseline for gold. Institutional ETF demand now creates a second, simultaneous floor. Having both official and institutional demand active at once strengthens gold’s structural support level.
The Edge Every Investor Needs
Smarter precious metals investing starts here. Get concise market insight, Fed updates, and trend analysis delivered to your inbox.
Subscribe for timely updates on gold and silver price action and key macro events that move markets.
Does China’s Buying Survive Tomorrow’s CPI?
July’s Consumer Price Index (CPI) is scheduled for release at 8:30 a.m. ET on Wednesday. Consensus estimates point to a 3.4% year-over-year headline number, a slight increase from June’s 3.3%, with core CPI expected around 2.5%.
A hotter-than-expected CPI would raise the odds of a September rate hike, lifting the dollar and real yields. Rising real yields create a headwind for gold because higher real returns increase the opportunity cost of holding a non-yielding asset. Conversely, a softer CPI would reduce rate-hike expectations, weaken the dollar, compress real yields, and improve the path for gold to move toward $4,500.
Importantly, China’s institutional rotation into gold is not dependent on one monthly CPI print. The movement is driven by portfolio construction decisions with multi-week to multi-month horizons. Short-term sentiment can flip on news, but systematic institutional reallocations tend to persist until risk and liquidity needs stabilize.
In other words: a single CPI report may influence short-term price swings, but it is unlikely to reverse a structural rotation driven by large institutions and central-bank reserve purchases.
What Is Supporting Gold’s Price Floor Right Now?
Three distinct sources of demand are anchoring gold’s floor today: the People’s Bank of China’s official reserve purchases; inflows from Chinese institutional investors into domestic gold ETFs; and the softer-than-expected U.S. jobs data in early August, which reduced the odds of a September Fed hike by roughly 14 percentage points.
Gold closed above $4,300 for the first time since early June on August 7, immediately following the jobs report, and it has held that level through subsequent sessions. The intraday retreat from the recent two-month high was quickly absorbed, demonstrating the depth of buying interest.
When official reserve accumulation, institutional ETF demand, and macro-driven yield dynamics align, the resulting support is structural rather than purely tactical. A hotter CPI print might push gold toward the lower end of its recent range, but it would not necessarily eliminate that multi-source floor. The underlying fiscal and macro backdrop — including U.S. federal debt above $39 trillion and annual interest obligations exceeding $1 trillion — creates broader constraints on monetary policy that extend beyond any single inflation release.
As of the most recent quotes, gold traded in the low $4,300–$4,400 range and silver remained more sensitive to rate uncertainty because of its larger industrial component. Investors watching precious metals should monitor institutional ETF flows, official reserve activity, and real-yield movements to gauge the durability of the current price floor.
Stay On Top of Gold & Silver Prices
Get important market alerts sent straight to your inbox.
Subscribe for concise market updates and analysis on precious metals.
SOURCES
1. Bloomberg — Chinese dip-buying bolsters gold as prices find a floor at $4,000 (August 4, 2026).
2. InvestingLive — Chinese investors pour $1.2bn into gold ETFs in the longest streak since March (August 7, 2026).
3. Yahoo Finance — Gold prices today, August 11, 2026: Gold remains over $4,400 amid geopolitical developments.
4. USAGOLD — Silver surged after payrolls unexpectedly fell (August 7, 2026).
5. South China Morning Post — Chinese profit-taking triggered record gold ETF outflows amid a shift to equities (July 8, 2026).
6. GoldSilver.com — Price charts and historical precious metals pricing data.
Disclaimer: This article is for informational purposes only and does not constitute investment advice. Past performance is not indicative of future results. Always consult a qualified financial advisor before making investment decisions.
You May Also Like:
- Why Is Silver Outperforming Gold Today? The Dual-Engine Mechanism Explained.
- How geopolitical rhetoric and negotiation stances could shape precious metals prices.
- Gold opened at its highest level since June: Five factors keeping it from moving higher.
- Gold had its best week since January — why upcoming CPI releases matter.
- What changed when one data point shifted market expectations and lifted gold.
- How the jobs report moved both gold and Fed rate expectations in the same direction.
Popular Topics
Picked from the archive
-
01
 Topics
Bond King Jeffrey Gundlach’s Gold Signal for Investors
-
02
Topics
Federal Reserve Goes Silent: Why Gold Investors Don’t Need It
-
03
Topics
Do Gold ETFs Mean You Own Physical Gold?
-
04
Topics
Gold, Silver and Stagflation: 5 Market Signals to Watch
-
05
Topics
Silver Price Outlook May 2026: Focus on Trends, Not Numbers
-
06
Topics
How the Federal Reserve Shrunk the Dollar’s Value 97% Since 1913
-
07
Topics
BEA Removed Silver From GDP: What It Means
-
08
Topics
South Korea’s Central Bank Resumes Gold Purchases After 13 Years