Why Silver Rose Despite JPMorgan’s Demand Warning

Last week, J.P. Morgan’s commodities team published a cautionary note about silver demand. The bank’s analysts highlighted two near-term headwinds: China and India, the largest silver-importing markets, are temporarily reducing purchases. China appears to be drawing down stocks it built before a change to photovoltaic export tax policy, while India has raised import duties to protect its foreign exchange reserves. Taken alone, that news might suggest downward pressure on silver prices.
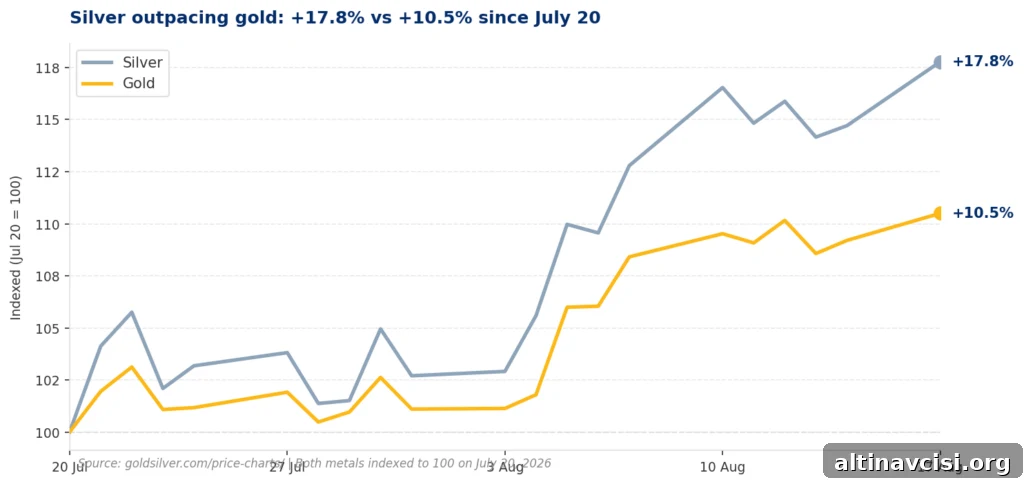
In practice, the market moved the other way: silver rose more than 2.5% and outperformed gold by better than two-to-one. Two distinct forces are moving silver right now — one monetary and the other industrial — and understanding both helps separate short-term noise from the longer-term picture.
What Is Firing Silver’s Monetary Engine Today?
The U.S. Dollar Index fell for a third straight session on Monday, sliding to its weakest level since mid-May 2026. That pullback traces back to last Friday’s retail-sales report: July retail sales declined by 0.6%, the first monthly drop in nine months and the largest monthly fall since May 2025. Economists had expected a modest gain.
That weaker-than-expected retail reading altered the market’s view of the Federal Reserve’s September decision. Before the data, markets treated a September rate hike as roughly a 50-50 prospect. By Friday afternoon, the odds priced by the CME FedWatch tool dropped to about 30–35%. A softer Fed outlook typically means a weaker dollar, which lowers the opportunity cost of holding non-yielding assets such as gold and silver and also makes those metals cheaper for buyers outside the U.S.
Gold responded to the dollar’s retreat with a gain of about 1%. Silver, however, moved more quickly because monetary conditions are only one of the factors driving its price.
What Is Firing Silver’s Industrial Engine at the Same Time?
Manufacturing strength is the second engine. The most recent ISM Manufacturing Index came in at 55.6, a four-year high and the seventh consecutive month above the 50 threshold that separates expansion from contraction. That signal matters more for silver than for gold.
About 58% of annual global silver demand is industrial, according to the Silver Institute’s World Silver Survey 2026. Silver is used directly in electronics, solar panels, electric vehicles and data-center components essential to AI and other advanced technologies. When manufacturing activity rises, the output of these products typically follows, increasing industrial silver consumption.
With both the monetary and industrial engines firing at once, silver has received a stronger combined stimulus than gold, helping explain the current outperformance.
Why Does JP Morgan’s Warning Not Break the Thesis?
J.P. Morgan’s analysts highlighted two real, policy-driven headwinds. China’s elevated imports in March reflected front-loading ahead of the removal of an export VAT rebate on photovoltaic products on April 1; after that change, a destocking phase followed. India’s higher import duties and tighter foreign-exchange rules reduced immediate import demand. Both effects are genuine and relevant to short-term flows.
But these influences are largely temporary and policy-specific, not structural changes to long-term demand. The broader market backdrop remains supportive: the Silver Institute reports the silver market is in its sixth consecutive annual supply deficit, with a projected 2026 shortfall of 46.3 million troy ounces. Since the deficit trend began in 2021, the cumulative drawdown of above-ground inventories is roughly 762 million troy ounces — a gap that cannot be closed by policy decisions or central-bank actions.
Put simply, China’s destocking followed a tax-driven timing shift rather than a collapse in solar demand, and India’s import limits reflect foreign-exchange management that could be reversed. Those near-term policy moves can influence flows and seasonality, but they do not erase a persistent structural deficit.
What Should Silver Holders Watch Next?
Two events will likely dominate the remainder of August. First, the Federal Open Market Committee minutes from the July 28–29 meeting will be released on Wednesday, August 19. That meeting produced a 9–3 hold decision, with three regional presidents voting for an immediate hike, so the minutes could reveal the depth of hawkish dissent and whether the majority’s stance is firming toward action in September.
Second, Fed Chair Kevin Warsh will give the keynote at the Jackson Hole symposium on Friday, August 28. It will be his first major speech since taking office on May 22, and because forward guidance has been de-emphasized by the current Fed leadership, his remarks carry added informational weight. Any hint that tight monetary policy will continue or that a September hike remains on the table could tighten conditions and put short-term pressure on precious metals.
Those events can influence price direction in the near term, but they do not alter the underlying supply-demand balance. Investors who focus on the mechanics — both monetary and industrial drivers — will be better positioned to interpret market reactions as they occur.
As of the latest available quotation cited in this piece, silver traded near $66.36 per ounce and gold near $4,421, giving a gold-silver ratio around 66.6. That ratio has compressed slightly from recent levels and sits close to its long-run average of roughly 65 over the past 50 years.
Two simultaneous engines, one persistent structural deficit, and a ratio near its historical mean help explain why a short-term demand warning from a major bank is an important data point — but not a complete rewrite of the market thesis.
Stay On Top of Gold & Silver Prices
Get important market alerts sent straight to your inbox.
SOURCES
1. Silver Institute — World Silver Survey 2026 (April 15, 2026). Global silver supply-demand balance; sixth consecutive annual deficit; 46.3 Moz shortfall.
2. J.P. Morgan Commodities Research (Gregory Shearer) — Silver Price Forecast 2026, China and India demand assessment.
3. US Census Bureau — Advance Monthly Retail Trade Survey, July 2026 (released August 15, 2026). Retail sales -0.6% MoM.
4. CME Group — FedWatch Tool, September 2026 FOMC rate decision probabilities, August 17, 2026.
5. Institute for Supply Management — Manufacturing ISM Report On Business, most recent reading (55.6, four-year high).
6. GoldSilver — Live Gold and Silver Spot Prices, August 17, 2026 (price references cited in this article).
7. Federal Reserve — FOMC Statement, July 29, 2026.
Disclaimer: This article is for informational purposes only and does not constitute investment advice. Past performance is not indicative of future results. Always consult a qualified financial advisor before making investment decisions.
You May Also Like:
- Gold Needed One Thing to Break $4,400. It Just Got Five of Them.
- Zero Tankers Crossed Hormuz on Sunday. Oil Hit $89. Gold Barely Moved.
- Gold Rebounds to $4,392 as Sentiment Crashes to 51 and Inflation Expectations Rise
- Gold Price and the September Fed Pivot: Five Data Prints Rewrote the Odds This Week
- The Fed’s September Math Just Changed. Here’s What It Means for Gold.
- Jackson Hole Is 14 Days Away. What Warsh Says Could Move Gold More Than Any Inflation Print.
Popular Topics
Picked from the archive
-
01
 Topics
Gold Prices Stabilize Amid Saudi-Iran Tensions
-
02
Topics
Why Gold Held Steady After Trump’s Economic Pressure on Iran
-
03
Topics
Oil Drops 11% as Gold Rises: What Investors Need to Know
-
04
Topics
3 Questions Investors Must Ask Before Buying Any Asset in 2026
-
05
Topics
Silver Surges Past $70 Amid Conflicting GDP Data
-
06
Topics
What’s Moving Gold and Silver Prices This Week
-
07
Topics
How FOMC Minutes and Jackson Hole Could Move Gold
-
08
Topics
Two Investors Ran Debt Math Separately and Chose 15 Percent Gold