How FOMC Minutes and Jackson Hole Could Move Gold
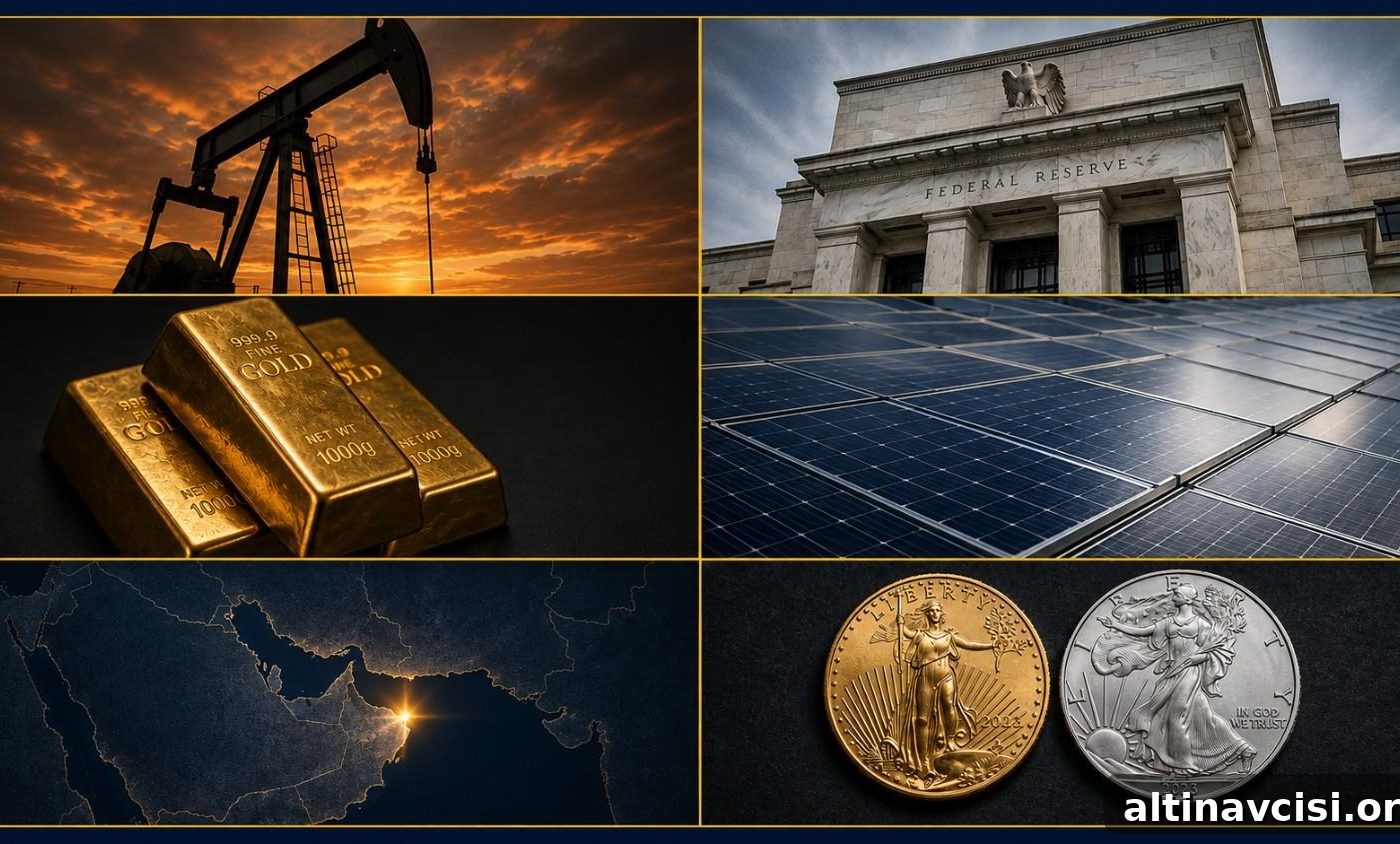
Gold is trading near $4,390.51 and silver near $64.74 today, both slipping as five key forces converge over the next nine days. The U.S.–Iran ceasefire window has closed. The Federal Reserve will publish FOMC minutes tomorrow. Former Fed official Kevin Warsh is scheduled to speak at Jackson Hole on August 28. Central banks recorded historically large gold purchases in Q2. And silver is underperforming gold for structural reasons. Taken together, these factors make the coming nine days pivotal for whether gold breaks above $4,450 or stalls below $4,400.
What Did the Iran Ceasefire Expiry Do to Gold Prices Today?
A 60-day memorandum of understanding between the U.S. and Iran that began on June 17 expired yesterday. The U.S. declined to extend the agreement and Iran signaled a more aggressive military posture. Oil prices pushed back toward the $90 level and long-term Treasury yields moved higher, with the 30-year note trading near its multi-year highs.
That combination helps explain why gold fell instead of rising on fresh geopolitical risk: higher oil tends to lift inflation expectations, which strengthens the case for additional Fed rate support and keeps the dollar firmer. A stronger dollar and elevated real yields are headwinds for gold in the near term. This does not undo the structural bullish argument for bullion — central-bank demand and persistent physical interest remain meaningful — but it does mean that in the immediate term gold’s price action will be driven by U.S. monetary policy signals.
The Edge Every Investor Needs
Smarter precious metals investing starts here. The Nuggets Newsletter delivers market insights, Fed updates, macro trends, and educational resources directly to subscribers.
Why Do the FOMC Minutes Tomorrow Matter More Than Usual for Gold?
The Federal Reserve will publish minutes from the July 28–29 meeting tomorrow at 2:00 PM ET. The summary statement already showed a 9–3 vote to hold rates, but the minutes will reveal the committee’s internal debate and the distribution of views. Market participants will watch closely to see if the three dissenters represented a marginal minority or a broader faction within the committee.
Recent soft economic data cut the odds of a September rate hike from roughly 50% to nearer 33%. If the minutes show that multiple policymakers were inclined toward further tightening — or that several members were uncomfortable with the hold — the market would likely repriced a higher chance of September action, pressuring gold. By contrast, evidence of a comfortable majority favoring the pause would reduce rate-hike odds and would be supportive for bullion. In short, the minutes could move gold significantly because they provide detail about policymakers’ conviction and reaction function beyond the public statement.
Is the Market Mispricing the Jackson Hole Risk to Gold?
Many traders are treating Kevin Warsh’s August 28 keynote at the Jackson Hole symposium as a likely trigger for renewed rate-hike expectations. That view assumes a podium moment will materially change market expectations.
History suggests Warsh favors concise, cautious commentary and has often avoided giving explicit market guidance. A speech framed as addressing “big questions” is consistent with that restrained approach and may not tip the market as some expect. Instead, the decisive signals for gold may already be embedded in the Fed’s internal dynamics — the same dynamics that tomorrow’s minutes will illuminate — rather than in a single public address nine days later.
What Does the Record Central Bank Gold Buying in Q2 Mean for Long-Term Holders?
World Gold Council and related industry reports show official-sector purchases rose sharply in Q2, with approximately 289 tonnes added — the strongest second-quarter buying on record. The People’s Bank of China accounted for a notable portion of that increase, adding its largest quarterly amount since late 2023. These official purchases occurred while gold retreated from January highs and exchange-traded funds trimmed holdings.
That pattern matters: central banks were buyers of the dip while some paper markets sold. Sustained institutional accumulation by sovereign and official buyers creates a structural demand base that can act as a price floor once the rate cycle begins to ease. For long-term holders, this persistent official-sector demand reduces downside risk relative to previous cycles and supports the case for gold as a strategic asset.
Why Did Silver Fall Harder Than Gold Today, and What Does That Tell You?
Silver declined about 1.70% today versus gold’s 0.62%, lifting the gold-to-silver ratio to roughly 67.82. That divergence reflects silver’s two-sided profile: it carries a monetary premium like gold, making it sensitive to interest-rate expectations, and an industrial premium tied to manufacturing and clean-energy demand.
When geopolitical tension and rate fears rise together, both the monetary and industrial premiums can be pressured simultaneously, amplifying silver’s downside. Industrial demand accounts for a substantial share of total silver consumption, while supply deficits have persisted in recent years. The result is a structural tightening in silver’s market that coexists with short-term volatility. Track the gold-to-silver ratio: a rising ratio suggests markets are treating current events primarily as monetary shocks with gold leading; a falling ratio would signal a risk-on rotation where silver typically outperforms.
Stay On Top of Gold & Silver Prices
Get timely market alerts and commentary delivered to your inbox.
SOURCES
1. Bloomberg — Trump Refuses Iran Truce Extension, August 18, 2026.
2. Reuters via Yahoo Finance — Oil prices climb, bond yields rise as US-Iran ceasefire expires, August 18, 2026.
3. Federal Reserve Board — FOMC Statement, July 29, 2026.
4. InvestingLive — Jackson Hole commentary and Warsh playbook, August 18, 2026.
5. Investing.com — EUR/USD and gold ahead of Fed Minutes and Warsh Jackson Hole debut, August 17, 2026.
6. Business Today — Silver deficit vs. gold central banks, citing World Gold Council Q2 2026 data, August 17, 2026.
7. State Street Global Advisors — August 2026 Monthly Gold Monitor (PBOC Q2 figures).
8. Trading Economics — Gold price data and narrative, August 18, 2026.
9. GoldSilver.com — Live gold and silver spot prices, August 18, 2026.
10. Federal Reserve Bank of Kansas City — Jackson Hole Economic Symposium, August 27–29, 2026.
Disclaimer: This article is for informational purposes only and does not constitute investment advice. Past performance is not indicative of future results. Consult a qualified financial advisor before making investment decisions.
You May Also Like:
- Three Fed Officials Voted to Hike. What It Means for Gold.
- Why Is Gold Not Going Up? The Bears Vanished in June.
- JP Morgan Just Flagged a Silver Demand Warning. Silver Rose Anyway. Here Is Why.
- Gold Needed One Thing to Break $4,400. It Just Got Five of Them.
- Zero Tankers Crossed Hormuz on Sunday. Oil Hit $89. Gold Barely Moved.
- Gold Rebounds to $4,392 as Sentiment Crashes and Inflation Expectations Rise.
Popular Topics
Picked from the archive
-
01
 Topics
Gold Prices Stabilize Amid Saudi-Iran Tensions
-
02
Topics
Why Gold Held Steady After Trump’s Economic Pressure on Iran
-
03
Topics
Oil Drops 11% as Gold Rises: What Investors Need to Know
-
04
Topics
3 Questions Investors Must Ask Before Buying Any Asset in 2026
-
05
Topics
Silver Surges Past $70 Amid Conflicting GDP Data
-
06
Topics
What’s Moving Gold and Silver Prices This Week
-
07
Topics
Two Investors Ran Debt Math Separately and Chose 15 Percent Gold
-
08
Topics
Iran Blinked: Powell’s One Word Will Decide the Next Move