Why Gold Drops During an Oil Price War
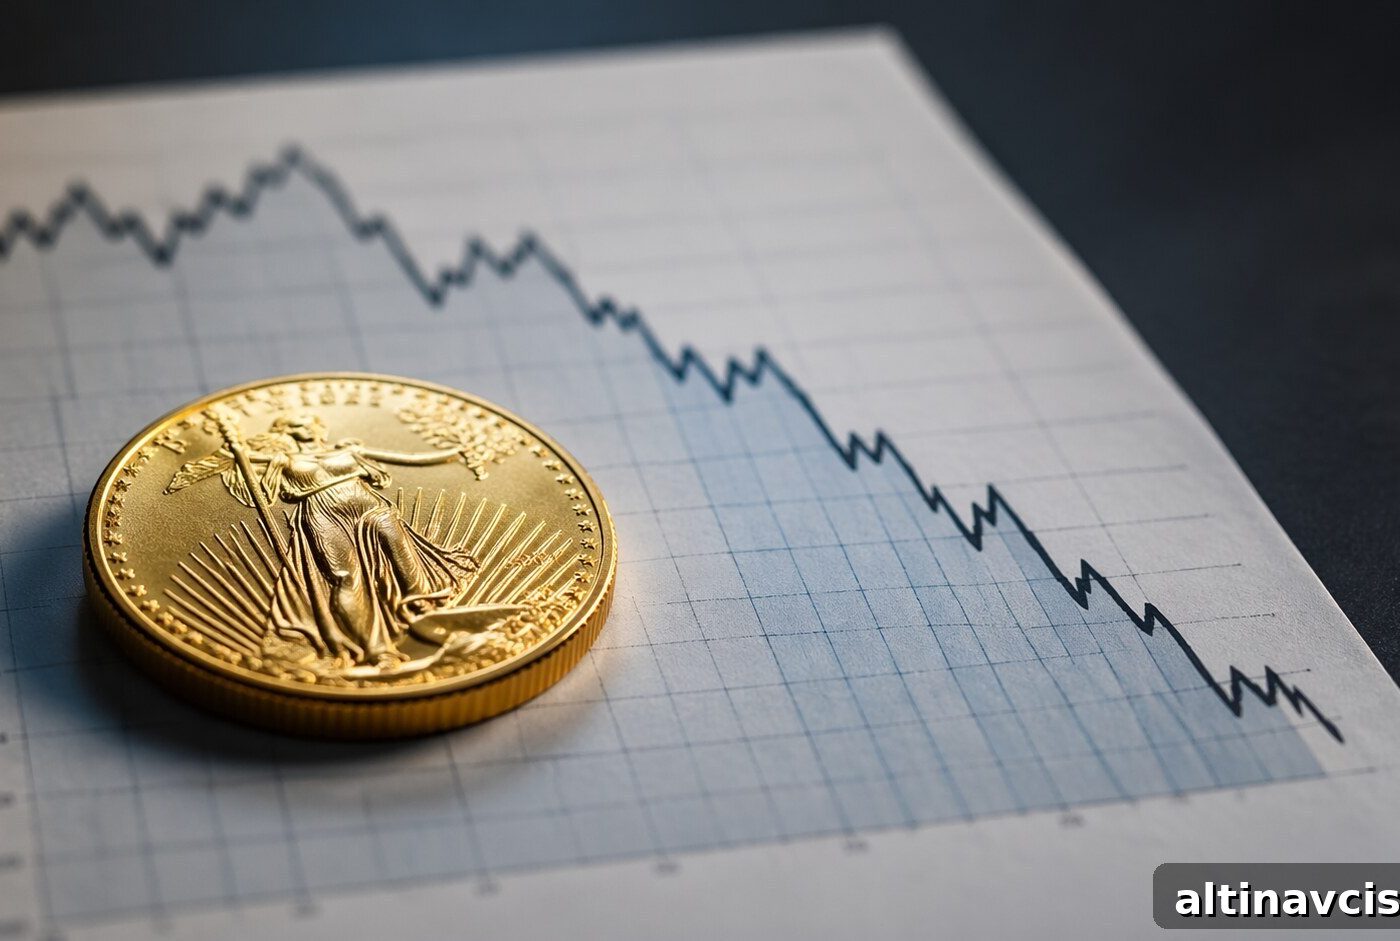
Gold and Silver market update – April 21, 2026
Key Takeaways
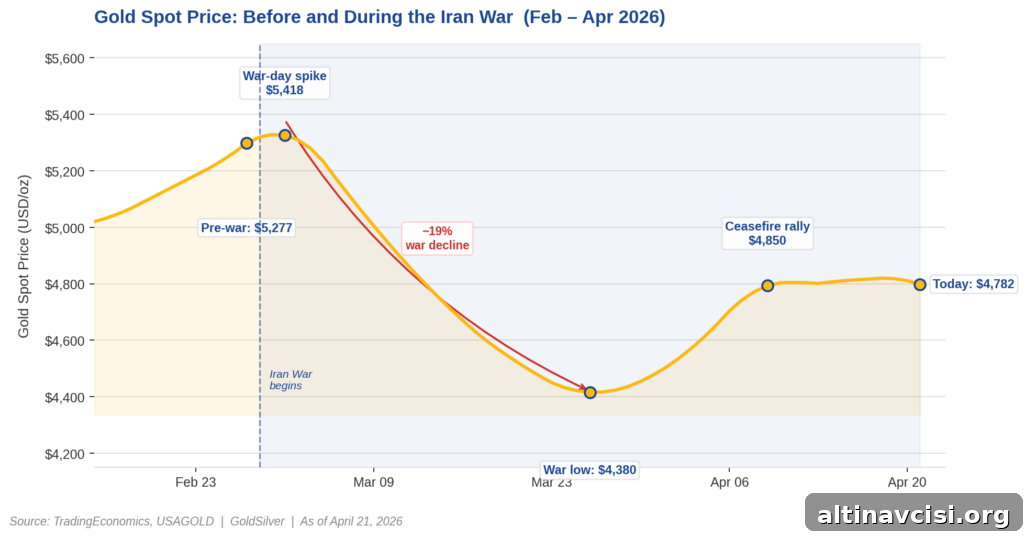
- Gold is down ~10% since February 28 — not because the long-term sound money case has failed, but because the Iran War pushed oil sharply higher, removed rate-cut expectations, and raised real yields, which pressurized paper gold prices.
- Paper and physical diverged — futures and ETFs sold off on macro repricing while physical dealer premiums widened and demand for coins and bars held up, indicating the spot dip reflects market structure rather than a collapse in intrinsic value.
- The fiscal case is intact — the US continues to run very large deficits and rising debt service, which over a multi-year horizon keeps pressure on real yields and supports the structural case for precious metals.
- The suppression reverses when oil falls — lower energy prices reduce CPI, restore rate-cut expectations, compress real yields, and allow paper gold to recover. Analysts estimate much of the war-related price pressure could reverse once oil eases.
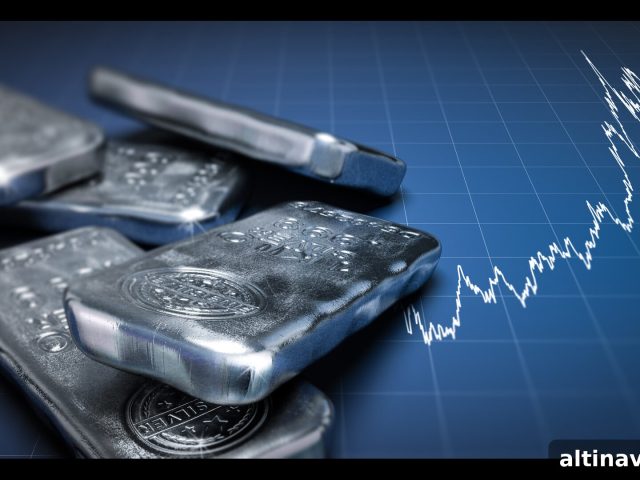
- Silver is leading the recovery — silver rallied strongly from its March low and has compressed the gold-silver ratio back toward its long-run average, suggesting renewed bullish dynamics for the broader precious metals complex.
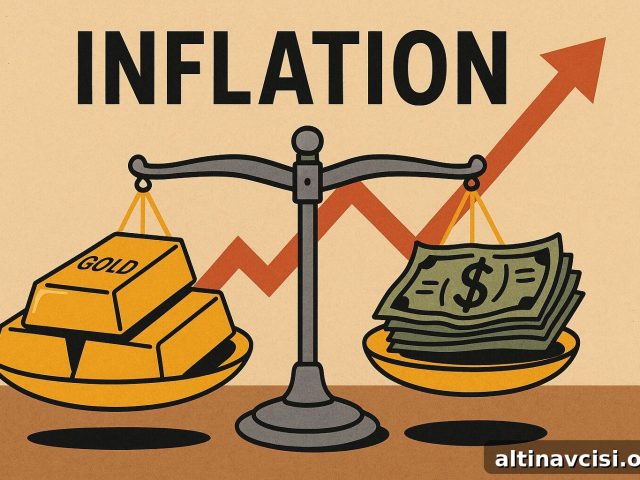
Since the Iran War began on February 28, 2026, gold has fallen roughly 10%, while crude oil surged by nearly 60% over the same period. Conventional logic suggests rising energy prices should strengthen gold as an inflation hedge. Instead, the metal sold off. Understanding why this happened matters for investors more than a short-term price move: the sell-off reflects a macro chain reaction that temporarily pushed real yields higher and changed institutional positioning.
Why Is Gold Falling During an Inflation Shock?
Gold declined because the war triggered a specific macro sequence. The conflict sent oil sharply higher, which increased inflationary readings and removed the expectation that central banks would quickly cut rates. With the Federal Open Market Committee holding rates at 3.50–3.75% and the market pricing a high probability of additional holds, owning a non-yielding asset such as gold became comparatively expensive for institutional allocations. Fund managers and futures desks adjusted positions accordingly.
More technically, gold tracks real yields — nominal interest rates less inflation expectations — more closely than it tracks inflation alone. When energy-driven inflation rises while the Fed remains restrictive, real yields can remain elevated, reducing the appeal of paper gold instruments (futures and ETFs). That dynamic explains why the price moved lower even as inflation concerns increased: the policy reaction forced a repricing that hurt paper positions.
The Edge Every Investor Needs
Smarter precious metals investing starts with timely market insight. This newsletter summarizes market drivers, Fed moves, and key commodity trends to help you make clearer decisions.
What Is the Difference Between Paper Gold and Physical Gold?
Paper gold — COMEX futures and large ETFs — behaves like a financial instrument. It reacts quickly to interest rate expectations, margining demands, and institutional risk models. When the war altered the rate outlook, these instruments were repriced and sold, which pushed the spot quotation lower.
Physical gold, by contrast, reacts to different incentives. Dealers and retail buyers focus on ownership transfer, inventory, and physical premiums. As paper prices fell, dealer premiums on coins and bars widened and retail demand remained firm. In other words, people who bought physical coins during the spike were not compelled to liquidate them because a futures desk adjusted its inflation projection. That divergence matters: the spot quote is influenced by where liquidity concentrates and how quickly different holders can react.
Does the Iran War Change the Long-Term Case for Gold?
No. The primary drivers of gold over a three- to five-year horizon are fiscal realities, not short-term geopolitics. U.S. budget deficits and rising debt service remain the structural context: the federal government continues to run very large annual deficits and pay substantial interest on Treasury debt. Those dynamics create fiscal dominance — a structural cap on how high real yields can sustainably go — which supports the longer-term case for precious metals.
Opponents will note that if the Fed maintains restrictive policy through 2027, real yields could stay elevated and weigh on paper bullion. That is true in the short term. But the arithmetic of record Treasury issuance and rising debt service narrows the window for persistently restrictive real yields. Over time, fiscal pressure tends to reassert itself, and that reinforces the multi-year constructive thesis for gold and silver.
What Happens to Gold When the War Ends?
History offers useful parallels. Past energy shocks raised inflation while central banks held rates, creating periods where bullion lagged headline inflation until policy shifted. Analysts estimate the war’s suppressive effect on gold could be large; one market note put the impact at as much as several hundred dollars per ounce. If oil falls and rate-cut expectations return, paper gold will have room to recover and recalibrate toward levels consistent with fiscal realities and longer-term inflation expectations.
Silver is already illustrating that potential recovery. From a war low in March, silver rallied strongly into April, compressing the gold-silver ratio toward its long-term average. That relative strength often signals a rotation back into physically intensive metals when investors anticipate easing policy and stronger industrial demand.
Near-term catalysts to watch include ceasefire developments, the Federal Reserve’s upcoming meetings, and inflation-expectations prints. A sustained decline in oil prices combined with renewed rate-cut expectations would be the clearest path for paper gold to retrace much of the recent weakness.
Stay On Top of Gold & Silver Prices
Receive timely market alerts and concise analysis delivered to your inbox.
Subscribe for price alerts, key Fed updates, and short takeaways that clarify the drivers behind precious metals moves.
SOURCES
1. CME Group — CME FedWatch Tool
2. Congressional Budget Office — The Budget and Economic Outlook: 2026 to 2036 (CBO projections)
3. Congressional Budget Office — Director’s Statement on the Budget and Economic Outlook: 2026 to 2036
4. Daily gold market reporting and dealer premium data (market industry sources)
5. TradingEconomics — Commodity price data and historical series
6. U.S. Energy Information Administration — oil and petroleum price reporting
By the GoldSilver Editorial Team — helping investors understand sound money since 2005. This article is for informational purposes only and does not constitute financial, investment, or tax advice. Always consult a qualified financial advisor before making investment decisions.
You May Also Like:
- What the Warsh Hearing Means for Gold Prices
- IMF Says Treasuries Aren’t Safe Anymore. Gold Noticed First.
- Gold Price After Ceasefire Violation: The Floor Has Moved
- Oil Crashed 11%. Gold Went Up. That Tells You Everything.
- $1 Trillion in Debt Interest Is Why Gold Keeps Climbing
- 5 Signals That Say Gold’s Bull Case Just Got Stronger
- The Largest Gold ETF Outflow Ever – But China Disagrees
- Silver Market Deficit 2026: Six Years and Getting Worse
Popular Topics
Picked from the archive
-
01
 Topics
Silver Soars to $75 as Gold Tops $4,500 Amid Stagflation Fears
-
02
Topics
CBO: Trump Tax Law Increases U.S. Deficit by 3.4 Trillion
-
03
Topics
Tech Giants Drive 90% of Earnings Growth Despite Trade War Fears
-
04
Topics
Silver Surges Past 38.50 as Rate Cut Bets Grow and Dollar Slips
-
05
Topics
U.S. National Debt to Top 53 Trillion Dollars by 2035, Exceed GDP
-
06
Topics
Gold vs Cash: How Inflation Destroys Dollar Purchasing Power
-
07
Topics
How to Take RMDs from a Precious Metals IRA
-
08
Topics
Gold Tops $4,000 as Shutdown Hits Jobs, Inflation and Airlines