Purchasing Power Explained: How Inflation Erodes Your Savings
Key Takeaways
- Purchasing power is the amount of real goods and services a unit of currency can buy. If the money supply grows faster than the economy, each unit of currency buys less — even when your bank balance number stays the same.
- Since August 15, 1971, the U.S. dollar has lost roughly 87% of its purchasing power based on CPI-U data. What cost $1 then costs about $8 today.
- Gold’s mined supply typically grows at under 1% per year. That structural scarcity helps explain why one ounce of gold has bought a comparable basket of goods across very different monetary eras.
- The Cantillon Effect means inflation is not felt evenly: those who receive newly created money first — banks, large institutions, and asset holders — benefit before prices fully adjust, while ordinary savers feel the loss later.
- Gold exists outside the fiat system. Governments cannot print it or dilute its supply by policy. That gives gold a fundamental advantage over currencies that can be issued at will.
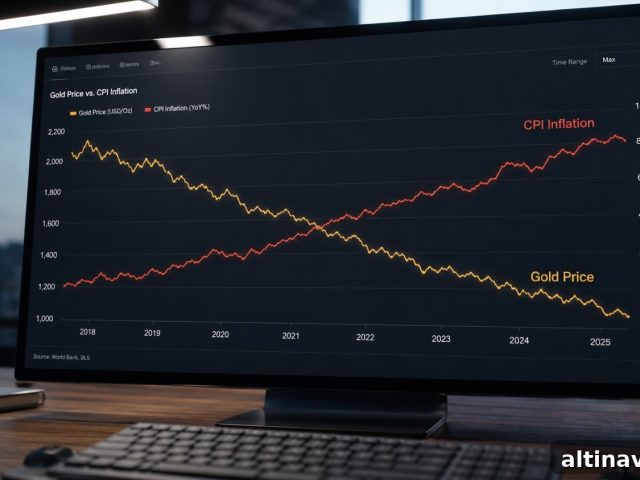
Purchasing power is simply how much real goods and services a unit of currency can buy at a given time. This metric doesn’t appear on bank statements, yet it is the most important measure of the real value of any savings. When the money supply increases faster than available goods and services, each existing dollar buys less. The U.S. Bureau of Labor Statistics tracks this change through the Consumer Price Index (CPI). Since the dollar’s formal link to gold was severed in 1971, the currency has experienced a long-term decline in purchasing power; in CPI terms that decline totals roughly 87%.
In June 2026, headline U.S. CPI registered 3.5% year-over-year. While that single-year reading may appear modest, even a maintained 2% annual inflation rate erodes a fixed dollar amount substantially over time: about an 18% loss of purchasing power per decade. Over a typical 30-year retirement horizon, those small annual losses compound into significant reductions in real wealth. Savers who understand this pattern plan accordingly rather than panic.
What Does Purchasing Power Actually Measure?
Purchasing power measures the real-world buying power of a currency unit: how much of a standard basket of goods and services that unit can purchase today compared with prior periods. The CPI is designed to capture that by tracking costs for categories such as food, housing, transportation, medical care, and education. When the CPI rises, each dollar buys a smaller share of that basket — a direct loss of purchasing power.
The Federal Reserve prefers the Personal Consumption Expenditures Price Index (PCE) as its policy gauge; PCE often runs a few tenths of a percentage point lower than CPI. Regardless of the index used, the cumulative effect over decades is what matters most: even low annual inflation compounds into meaningful reductions in real savings.
The Knowledge That Changes Everything
Two essential guides — yours free. Learn why gold matters and how fiat systems have behaved historically.
What Has Happened to the Dollar’s Purchasing Power Since 1971?
A pivotal moment came on August 15, 1971, when President Nixon ended the dollar’s convertibility into gold at the fixed rate of $35 per ounce, closing the Bretton Woods arrangement. Prior to that, foreign central banks could exchange dollars for gold, which constrained how rapidly the U.S. could increase its money supply. Once that constraint ended, monetary expansion became easier, and over the following decades the dollar’s purchasing power declined steadily rather than collapsing in a single event.
BLS CPI-U data indicate the dollar has lost about 87% of its purchasing power since 1971. The erosion unfolded across many years and episodes, not as a single catastrophic failure. One recent acceleration occurred between February 2020 and April 2022, when the M2 money supply rose from $15.4 trillion to $21.8 trillion — roughly a 41% jump in 26 months — contributing to a CPI peak of 9.1% in June 2022. Headline inflation has moderated since, but remains above historical policy targets.
Why Does Fiat Currency Lose Purchasing Power Over Time?
Fiat currencies lack a physical cap on their supply. Governments and central banks can expand money via bond purchases, lending facilities, or reserve creation. When new money enters circulation faster than the economy’s capacity to produce goods and services, prices rise. Each unit of the existing currency then buys less.
This process has repeated throughout history in many forms. For example, the Roman denarius was progressively debased over centuries, which contributed to inflationary pressures and economic instability. The toolset has changed, but the incentive to expand a fiat money supply when politically or economically convenient remains a consistent force.
Who Bears the Cost When Purchasing Power Falls?
Inflation is often described as uniform, but its effects are uneven. The Cantillon Effect explains that newly created money reaches certain actors first — banks, large financial institutions, government contractors, and major asset holders. These early recipients can spend or invest before prices have adjusted, acquiring goods and assets at earlier prices. Ordinary wage earners and savers encounter higher prices later, after purchasing power has been redistributed.
For individuals, this means that protecting wealth requires more than relying on nominal balances. Because the timing of money creation and its transmission matters, some people capture the benefits of monetary expansion while others bear the costs.
How Does Gold Preserve Purchasing Power?
Gold’s advantage lies in its physical scarcity. Global mine production typically grows at under 1% per year, a rate no government policy can meaningfully accelerate. That limited supply is why one ounce of gold has maintained a broadly similar purchasing power across centuries, even as fiat monies around it rose and fell.
Historical comparisons support this feature. Studies comparing Roman-era wages denominated in gold to modern military pay show a recognizable continuity when measured in ounces of gold. Likewise, the long-run gold-to-oil ratio has tended to stay within a durable range, demonstrating gold’s role as a long-term store of value across very different commodity cycles and monetary environments.
What Most Investors Miss About Purchasing Power and Gold
Many investors view gold simply as an inflation hedge that moves with CPI. That view is incomplete. Gold’s behavior is closely tied to real interest rates — the return on interest-bearing assets adjusted for inflation. When real rates are low or negative, the opportunity cost of holding non-yielding gold falls, and gold becomes a more attractive place to store value without counterparty risk.
More importantly, gold’s protective role is a decades-long dynamic rather than a short-term trading edge. Investors who focus on week-to-week price movements miss the point. The prudent question is what an ounce of gold will buy in ten or twenty years as monetary systems evolve and balance sheets expand.
What Does Purchasing Power Erosion Mean for Long-Term Savers?
For long-term savers, purchasing power erosion is a real, predictable threat. At an average annual inflation rate near 3% — close to the historical average since 1971 — the real value of fixed nominal savings roughly halves in about 24 years. That has direct consequences for retirement planning and wealth preservation.
Compounding that effect, the Cantillon Effect means that assets like real estate and financial securities often rise first when new money is created, while wages and cash balances lag. Holding only cash and bonds can therefore result in a double hit: rising prices for essential goods and rising prices for assets you might want to buy later.
Physical gold addresses both challenges: its supply can’t be inflated by policy, and it carries no counterparty risk. Central banks have been net buyers of gold in recent years, reflecting institutional recognition of gold’s role as a long-term reserve asset rather than a speculative play.
Stay On Top of Gold & Silver Prices
Get important market alerts sent straight to your inbox.
People Also Ask
What is purchasing power in simple terms?
Purchasing power is how much real goods and services a dollar can buy at a given time. If prices rise faster than incomes, each dollar buys less. The CPI tracks the cost of a representative basket of goods; when the CPI climbs, purchasing power falls by the corresponding amount.
Why does fiat currency lose purchasing power over time?
Fiat currency loses purchasing power because its supply can be increased by governments and central banks. More money chasing the same goods drives prices up, reducing the real value of existing currency units. Since the U.S. ended the dollar’s gold convertibility in 1971, the dollar has experienced substantial long-term erosion in purchasing power.
How does gold preserve purchasing power?
Gold preserves purchasing power because its supply grows very slowly and cannot be expanded by policy. This physical scarcity means that, across long spans of monetary history, an ounce of gold has retained the ability to buy a meaningful bundle of goods and services, making it a reliable long-term store of value.
How much purchasing power has the dollar lost since 1971?
Based on CPI-U measures, the dollar has lost about 87% of its purchasing power since August 15, 1971. Prices rose gradually over decades, with notable accelerations during the 1970s, after the 2008 crisis, and during the 2020–2022 pandemic-related monetary expansion.
What is the Cantillon Effect and how does it affect savers?
The Cantillon Effect describes the uneven distributional consequences of newly created money. Those who receive the new money first can spend or invest at earlier prices, while ordinary savers see prices rise by the time new money reaches them. The result is a redistribution of purchasing power toward those nearest the money source.
SOURCES
1. Bureau of Labor Statistics — Consumer Price Index Summary, June 2026; CPI-U Purchasing Power of the Consumer Dollar (FRED series).
2. Federal Reserve Bank of St. Louis — M2 Money Supply (M2SL); Cleveland Fed — analysis of CPI vs. PCE.
3. World Gold Council — central bank gold reserve and mine supply data (full-year 2025 reports).
4. Erb, Claude B. and Harvey, Campbell R. — “The Golden Dilemma” (Financial Analysts Journal, 2013).
5. U.S. Energy Information Administration / Federal Reserve Bank of St. Louis — historical gold-to-oil ratio data.
6. Richard Cantillon — “Essay on the Nature of Trade in General” (1755).
7. Defense Finance and Accounting Service — 2026 military basic pay tables.
8. Industry analyses on dollar devaluation and gold versus inflation trends.
Disclaimer: This article is informational only and not financial or investment advice. Consult a qualified adviser before making financial decisions.
You May Also Like:
- Why Hong Kong? Inside Offshore Gold Storage Networks
- Silver Price Outlook July 2026: Two Catalysts, One Setup
- Why the 10-5-3 Rule Fails Precious Metals Investors
- Why Is Silver So Hard to Mine? The Primary Supply Problem Explained
- Gold Price Outlook July 2026: The Price Fell. Case Intact.
- Buying the Top: A Survival Guide for Gold and Silver Investors
- How Do Gold Price Cycles Work? A Framework Across Four Time Horizons
Popular Topics
Picked from the archive
-
01
 Topics
After Major Silver Price Crashes: What Investors Can Expect
-
02
Topics
Gold Price Outlook June 2026: CPI Impact and Fed Signals
-
03
Topics
Why Gold Failed to Rally Today: 5 Key Reasons
-
04
Topics
Is the Gold Price Correction Over? Rebound Signals for Investors
-
05
Topics
Why Silver Dropped 3.3% vs Gold’s 1.6%: The Gap Explained
-
06
Topics
How the London Gold Fixing Shapes Global Gold Prices
-
07
Topics
Could Silver Prices Reach $75 After Surging Past $60?
-
08
Topics
Gold Price Near $5,000 as Fed Battles Sticky Inflation