Gold Price Outlook June 2026: CPI Impact and Fed Signals
Key Takeaways
- US inflation rose to 4.2% year-over-year in May 2026 — the strongest reading since April 2023 — driven largely by a 23.5% jump in energy prices connected to the Iran conflict [Bureau of Labor Statistics, June 10, 2026]. Core CPI (excluding food and energy) remained at 2.9%.
- Gold trades near $4,165, about 25% below its January 28 all-time high of $5,589, and has closed under its 200-day moving average for the first time since October 2023.
- The June 16–17 FOMC is Kevin Warsh’s first meeting as Fed Chair. Markets strongly favor a pause, but still price roughly 70% odds of at least one hike by December [CME FedWatch Tool, June 9, 2026].
- Central banks continued to add to gold reserves in 2026, buying a net 244 tonnes in Q1 and resuming purchases in April [World Gold Council]. China has increased reserves for 18 consecutive months.
- Major institutional year-end gold forecasts — Goldman Sachs ($5,400), JPMorgan (~$6,000), Morgan Stanley ($5,200), UBS ($5,500) — remain substantially above current levels, implying 25–44% upside.
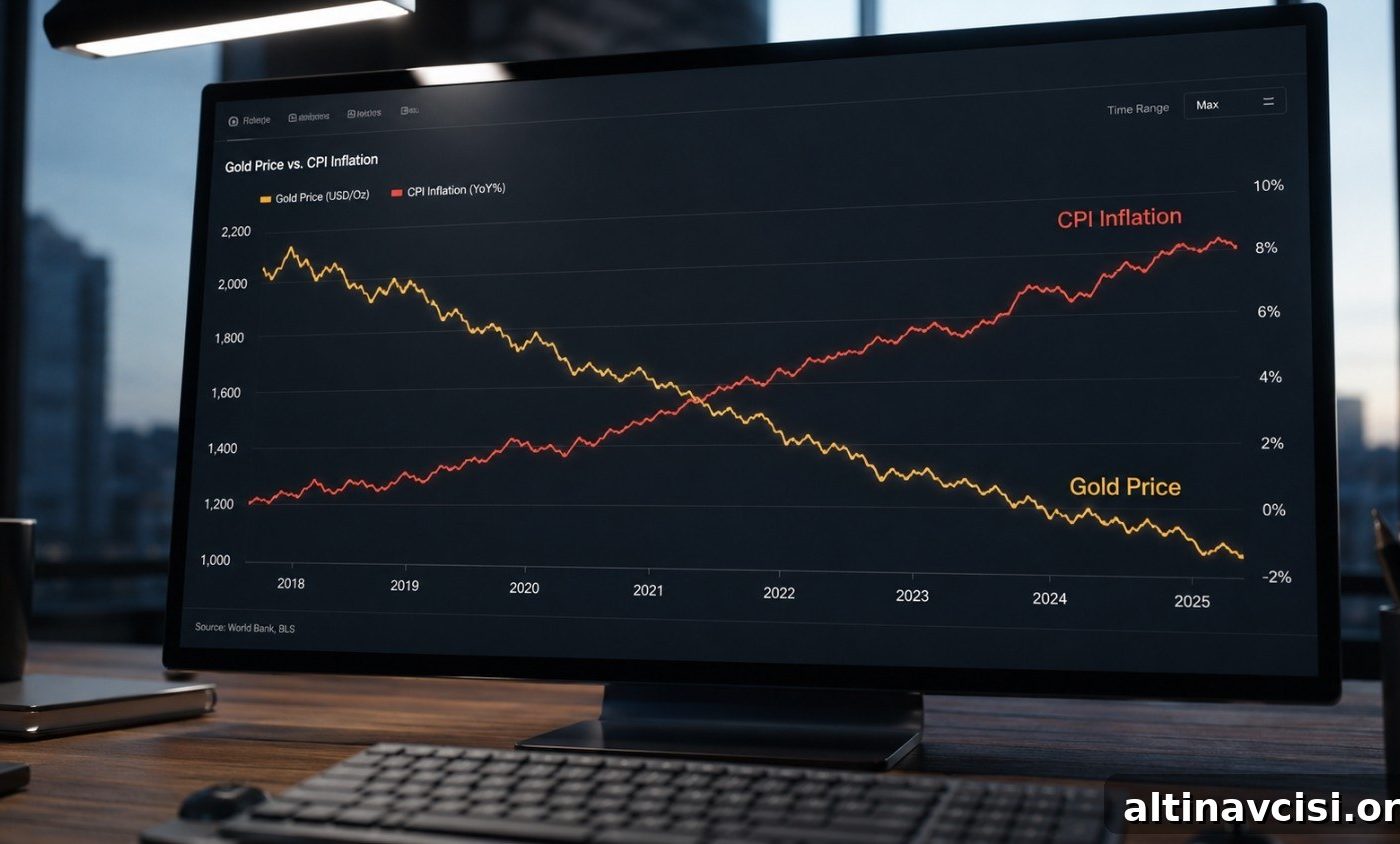
The U.S. Bureau of Labor Statistics reported on June 10, 2026 that the Consumer Price Index rose 4.2% year-over-year in May, the highest level since April 2023. Gold is trading around $4,165, roughly 25% below the January high of $5,589 and below its 200-day moving average for the first time since October 2023.
Has the investment thesis for precious metals changed? The short answer: no. To understand why, look beyond the headline numbers to the drivers behind this pullback, the detail many outlets missed in today’s CPI report, and the implications of Kevin Warsh’s first FOMC as Fed Chair.
Why Is Gold Down 25% in June 2026?
Gold’s decline from $5,589 to about $4,165 reflects two near-term shocks that combined to push real yields higher — the key mechanism that pressures non-yielding assets like gold.
First, disruption linked to the US-Iran conflict affected shipping through the Strait of Hormuz, a critical conduit for global oil supply. Oil moved above $100 and then $110 per barrel, lifting energy costs by 23.5% year-on-year and accounting for more than 60% of May’s monthly CPI increase. Higher energy prices raised headline inflation, which in turn reduced expectations for near-term rate cuts and kept nominal yields elevated. Since gold does not pay interest, higher yields increase the opportunity cost of holding it.
Second, the May jobs report surprised to the upside: the U.S. added 172,000 jobs, well above the consensus expectation. That stronger labor-market reading diminished prospects for easing and pushed December hike odds higher. Investment banks revised near-term easing expectations, and positioning adjusted accordingly.
Both shocks simultaneously reinforced higher real yields and precipitated the correction. Importantly, none of these events invalidates the structural reasons investors hold physical precious metals.
What Does Today’s CPI Actually Tell Us About Gold?
The 4.2% headline matched expectations and largely reflected energy price swings. The more informative figure is core CPI, which excludes volatile food and energy components. Core CPI came in at 2.9% year-over-year, with a 0.2% monthly increase — below the 0.3% consensus. That lower-than-expected monthly core reading indicates that price pressures in services, wages and shelter are not broadly accelerating.
May’s inflation pulse was concentrated in energy. Shelter inflation actually slowed — monthly shelter rose 0.3% in May versus 0.6% in April — and some transportation services declined. The Fed cannot directly control geopolitically driven oil prices with interest-rate policy. Bond markets recognized this nuance: Treasury yields showed limited reaction after the release, even though headline inflation reached a three-year high.
For policymakers, that creates a constrained choice. Inflation sits above the 2% objective, but its source is largely geopolitical. The labor market remains tight, and hiking into an oil-supply shock risks tipping the economy into recession. Warsh’s first meeting will be shaped by these data realities, not by personal preferences alone.
What Will Warsh’s First FOMC Mean for Gold?
The June 16–17 meeting carries extra significance because it is Kevin Warsh’s first Federal Open Market Committee as Chair. In addition to the policy decision, the Fed will publish a new dot plot showing each committee member’s rate projections for the coming years. Markets are pricing a near-certain pause for this meeting, but the dot plot — and the language surrounding inflation versus growth and fiscal constraints — will determine forward expectations.
Three factors will shape gold’s near-term reaction:
- The median dot for year-end 2026: If it signals a continued hold, gold could recover as positioning rebalances. If it implies another hike by December, the dollar and yields may strengthen further and weigh on gold.
- Warsh’s framing of inflation versus growth: Warsh is known for emphasizing price stability, but the U.S. fiscal backdrop — with federal debt above $37 trillion and annual interest costs exceeding $1 trillion — means aggressive tightening carries fiscal and growth trade-offs. How he articulates that trade-off will matter.
- Hidden scenarios: A hike into an economy affected by an oil shock can produce stagflationary conditions — a combination of high inflation and slowing growth — which historically favors gold. Some institutions already factor that into both rate and gold outlooks.
The dot plot initiates a conversation that will play out over Q3; it does not deliver a final verdict on the cycle.
Where Do Major Banks See Gold by Year-End 2026?
This correction has lowered near-term prices relative to institutional targets but has not led major banks to abandon their year-end calls. Examples include Goldman Sachs ($5,400), JPMorgan (~$6,000), Morgan Stanley ($5,200 for H2) and UBS ($5,500). The LBMA survey of analysts shows a consensus full-year average near $4,742. All published targets remain above the current spot price.
In short, the pullback has improved the entry point relative to these forecasts rather than signalling a structural breakdown.
Are Central Banks Still Buying Gold in 2026?
Yes. Central-bank gold purchases have continued despite price volatility. Net buying totaled 244 tonnes in Q1 2026, above recent averages, and resumed in April with another 17 tonnes. Poland and China were notable buyers: Poland added 14 tonnes in April and China added 8 tonnes, extending its consecutive-month buying streak to 18 months. Central banks pursue long-term reserve strategies; short-term price swings rarely change that approach.
What Is the Gold-Silver Ratio Signalling Right Now?
The gold-to-silver ratio shows how many ounces of silver buy one ounce of gold. On June 10, 2026, with gold near $4,165 and silver around $65.24, the ratio was roughly 63.9. That is higher than the 55–60 range seen earlier in the year and signals that silver has cheapened relative to gold.
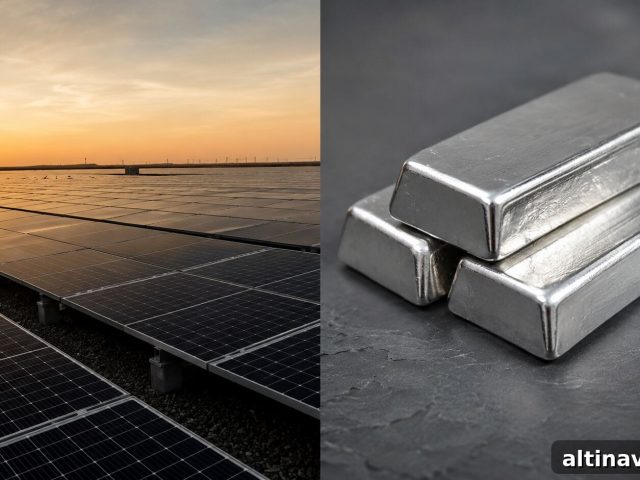
Silver’s price is driven by two forces: monetary factors (real yields, dollar strength, inflation expectations) that move with gold, and industrial demand (solar, electric vehicles, electronics) that follows a separate cycle. When rate-hike fears dominate, silver often underperforms gold. Historically, ratios between 60 and 70 have preceded periods when silver outperforms during bull-market recoveries, so the current ratio supports a relative-value case for silver.
Is Now a Good Time to Buy Gold or Silver?
A 25% correction in an ongoing bull market is significant but not a structural reversal. This drawdown stems from two time-limited shocks — an oil-driven inflation surge and a strong jobs report — arriving simultaneously. Both are likely temporary: geopolitical tensions resolve or traders finish pricing them, and core inflation data shows signs of decelerating month-to-month.
The longer-term structural factors supporting precious metals remain in place: large and rising sovereign debt burdens, ongoing central-bank purchases, a gradual decline in the dollar’s share of global reserves, and the unique utility of physical metal as a non‑counterparty store of value. Dollar-cost averaging can be an effective way to build exposure, buying more ounces when prices fall and fewer when prices rise.
At approximately $4,165 for gold and $65 for silver, both metals trade well below many institutional year-end targets, reflecting the arithmetic of a correction within an intact bull market rather than a broken thesis.
People Also Ask
Is gold still a good investment in June 2026?
For long-term investors, yes. The recent pullback is the deepest of the current cycle but stems from temporary macro events rather than a fundamental change in the role gold plays as a hedge against inflation, currency risk and fiscal stress. Central-bank buying and high sovereign debt levels continue to support demand.
What will the June 16–17 Fed meeting mean for gold?
Markets expect a hold at the meeting, but the new dot plot and Chair Warsh’s comments will be decisive. A neutral dot plot could ease a key headwind and allow gold to recover, while a dot plot implying more hikes would likely extend pressure on prices in the near term.
Why is gold falling while inflation is rising to 4.2%?
Gold reacts primarily to real yields (nominal yields minus inflation expectations). Geopolitical energy shocks can raise nominal yields and reduce the likelihood of rate cuts, keeping real yields elevated and increasing the opportunity cost of holding gold. That dynamic explains why gold can fall even as headline inflation rises.
What is the gold price forecast for the rest of 2026?
Institutional year-end targets vary but generally remain above current levels: Goldman Sachs $5,400; JPMorgan ~$6,000; Morgan Stanley $5,200 (H2); UBS $5,500. The LBMA analyst-survey consensus full-year average is near $4,742. Key catalysts include a neutral dot plot from the Fed, a resolution of shipping disruptions in the Strait of Hormuz, or continued central-bank buying through H2.
What is the gold-to-silver ratio, and what does 63.9 mean?
The ratio indicates how many ounces of silver are required to buy one ounce of gold. At approximately 63.9, silver is cheaper relative to gold than it was earlier in 2026, and historically that range can precede periods when silver outperforms once monetary headwinds ease.
The Knowledge That Changes Everything
Two essential guides — free. Learn why gold matters and how fiat currencies lose value over time.
To receive the free guides, visit our site and subscribe via the newsletter form.
Stay On Top of Gold & Silver Prices
Get important market alerts delivered to your inbox.
Subscribe on our site for market alerts and updates.
What Should Physical Holders Do Now?
If you already hold physical gold or silver, this correction does not change the reasons you own them. Physical metal carries no counterparty risk, is not subject to margin calls, and cannot be debased by monetary policy. The recent price movement reflects short-term positioning and rate expectations — not a change in the long-term case.
If you are adding to a position, consider the benefits of acting before the June 17 FOMC instead of waiting. Once the new dot plot and Fed communication arrive, much of the rate uncertainty that has suppressed prices will resolve. A disciplined approach such as dollar-cost averaging removes the need to time the bottom: regular purchases accumulate more ounces when prices fall and fewer when they rise.
Current spot prices — gold near $4,165 and silver near $65 — sit well below many institutional year-end targets, while the same structural drivers that pushed gold to its January high remain intact.
SOURCES
1. U.S. Bureau of Labor Statistics — Consumer Price Index, May 2026.
2. U.S. Bureau of Labor Statistics — Employment Situation, May 2026.
3. nFusion Solutions — Gold/Silver Spot Prices, June 10, 2026.
4. World Gold Council — Gold Demand Trends Q1 2026.
5. World Gold Council — Central Bank Gold Statistics, April 2026.
6. CME Group — FedWatch Tool, June 2026 FOMC Probabilities.
7. Goldman Sachs Global Research — 2026 Gold Price Target and Rate Forecast Update.
8. J.P. Morgan Global Research — 2026 Gold Price Forecast Update.
9. Morgan Stanley Commodities Research — H2 2026 Gold Price Forecast.
10. UBS Global Research — Precious Metals Forecast Update, May 2026.
11. London Bullion Market Association — 2026 Annual Precious Metals Forecast Survey.
12. U.S. Treasury — Fiscal Data, Federal Debt and Interest Expense.
13. Federal Reserve — Kevin Warsh, Federal Reserve Chair.
14. IMF — Currency Composition of Official Foreign Exchange Reserves.
Disclaimer: This article is for informational purposes only and does not constitute financial or investment advice. Consult a qualified financial adviser before making investment decisions.
You may also like:
- How Gold Price Is Set: The East-West Tide Explained
- Does Physical Gold Have Counterparty Risk? The Facts
- Why Is Gold Still a Safe Haven? Insights from Major Refiners
- Rate Hike Odds and Gold: Why Prices Move on Policy Expectations
- Gold Confiscation: Historical Context and Modern Risk Considerations
- Gold Price History: From $35 to Modern Highs — A Century of Change
- The Debasement Trade Explained: Mechanism, History, and What It Means for Gold
- Gold or Silver First? A Practical Guide for New Buyers
Popular Topics
Picked from the archive
-
01
 Topics
Trump $2,000 Stimulus Checks, Auto Loan Crisis and Silver Rally
-
02
Topics
Silver Rises 3% to $88 as Markets Shrug Off Risk
-
03
Topics
Warsh Inflation Measure: What It Means for Gold Prices
-
04
Topics
After January Jobs Surprise, Silver Dips as Gold Holds Firm
-
05
Topics
IMF: Treasuries Are No Longer Safe, Gold Reacted First
-
06
Topics
AI Bubble Fears Surge as Gold Price Falls Below 4,000 USD
-
07
Topics
How to Check If Your Gold Storage Is Allocated
-
08
Topics
How Stagflation Sparks Both Drivers of Silver