How Stagflation Sparks Both Drivers of Silver
What to Know
- Silver has two distinct demand streams — industrial and monetary — that usually offset one another. Stagflation is the unusual environment in which both strengthen simultaneously.
- Industrial demand for silver is structurally driven and does not fall in lockstep with GDP. Solar, electric vehicle (EV), and AI data center buildouts depend on regulatory mandates and long-term technology investment rather than short-term economic cycles. Battery EVs use significantly more silver than combustion vehicles (Silver Institute / Oxford Economics).
- The market supply deficit is now in its sixth consecutive year. The World Silver Survey 2026 projects a 46.3 million ounce shortfall in 2026, growing from 40.3 million ounces in 2025. Since 2021, roughly 762 million ounces have been drawn from above-ground inventories.
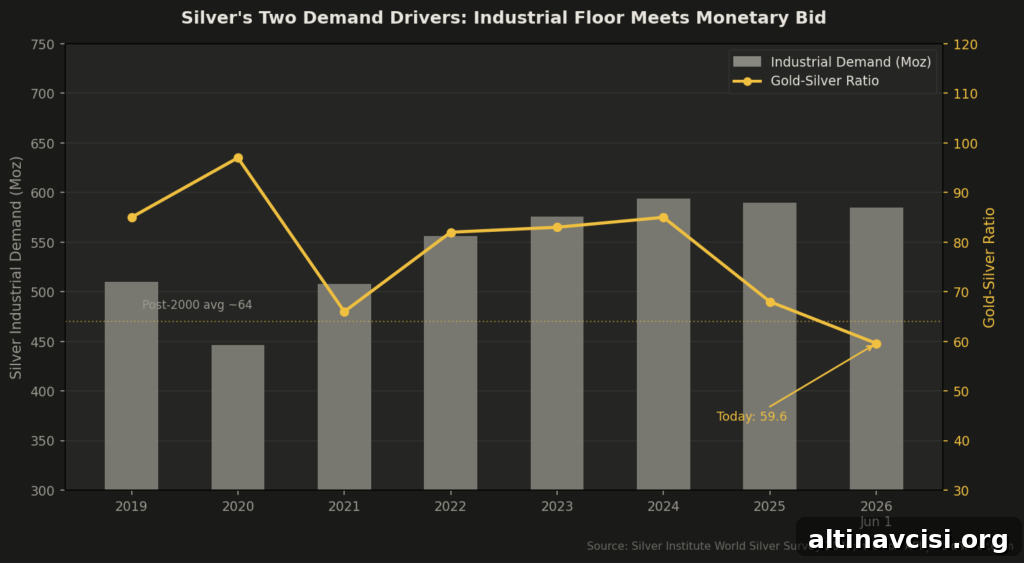
- The gold‑silver ratio sits near 60.0 today — close to its post‑2000 average and well above the January 2026 low of about 46:1. The Fed’s current rate‑hold explains both silver’s recent underperformance and its broader structural setup.
Most assets respond predictably to stagflation. Bonds lose purchasing power, equities struggle as growth stalls, and cash erodes in value. Gold typically benefits: inflation is elevated, real yields remain suppressed, and central banks face constrained policy choices. Silver, however, behaves differently because it is guided by two separate demand dynamics — industrial uses and monetary demand — which usually counterbalance each other. Stagflation is the rare macro state that aligns both in the same direction. Understanding that alignment clarifies why silver’s current market position is more than price action suggests.
What Are Silver’s Two Demand Drivers?
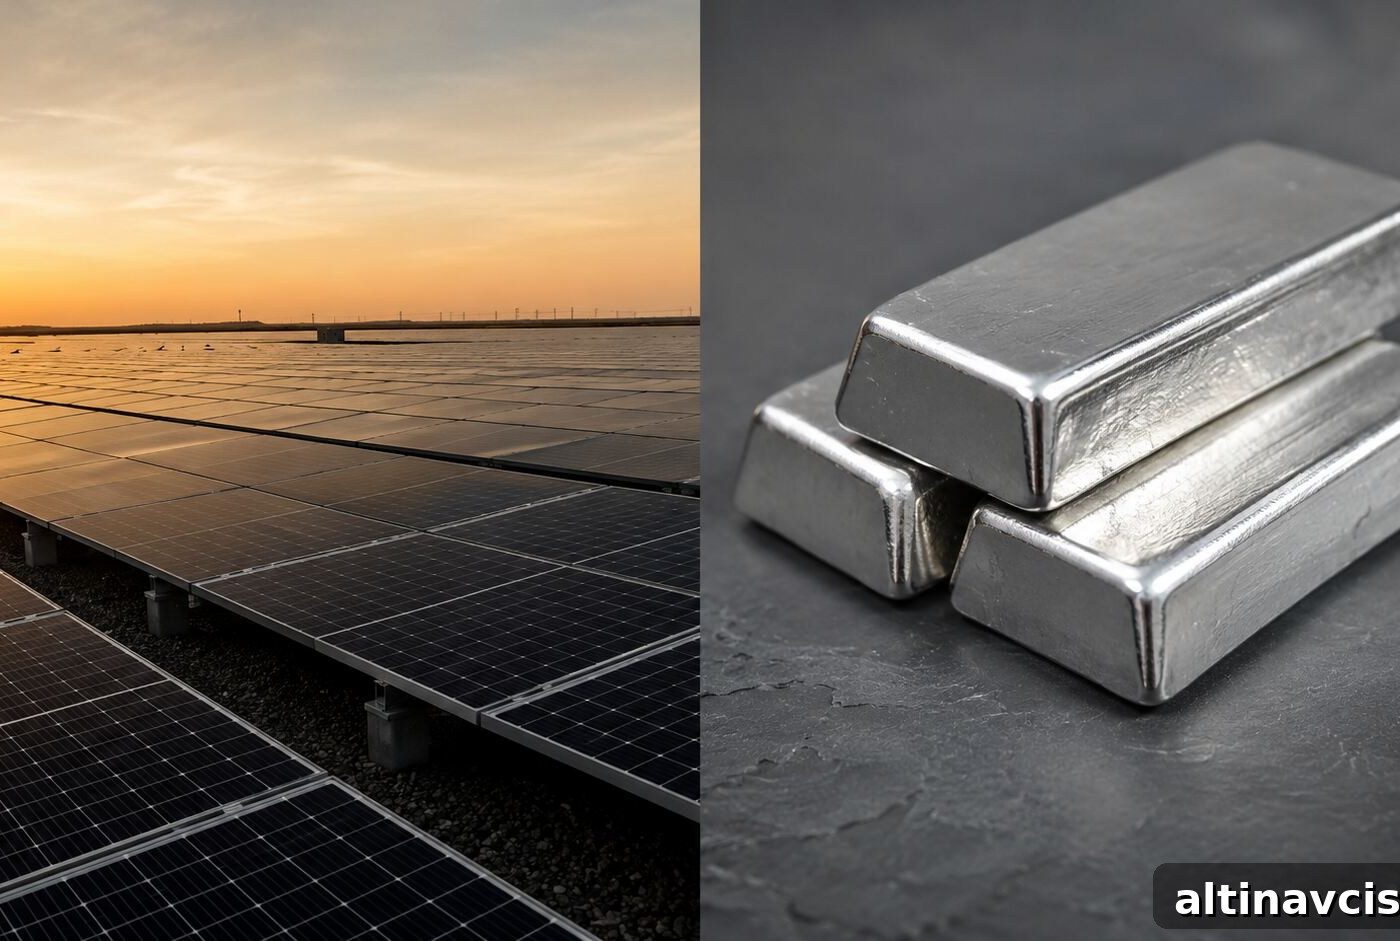
Silver serves two fundamentally different roles. One is monetary: silver is held as a store of value and bought as a safe haven alongside gold. The other is industrial: silver is consumed in solar panels, electric vehicles, semiconductors, medical devices, and AI data center infrastructure. The Silver Institute estimates that roughly 58% of global silver demand comes from industrial applications.
In normal economic cycles these two drivers often pull in opposite directions. Strong growth and low inflation boost industrial demand while reducing the monetary bid. Conversely, a recession tends to increase monetary demand while industrial consumption falls. That tug‑of‑war makes silver more volatile than gold, which is driven almost exclusively by monetary demand. Stagflation is the exception, when both engines can run together.

The Edge Every Investor Needs
Smarter precious metals investing starts here. The Nuggets Newsletter delivers market insights, Fed updates, trend analysis, and educational resources.
Why Is Stagflation Uniquely Bullish for Silver?
Stagflation combines elevated inflation with below‑trend economic growth. In the current U.S. context, headline personal consumption expenditures (PCE) is around 3.8% (April 2026), while first‑quarter GDP growth ran near 1.6%. That mix leaves the Federal Reserve politically and economically constrained: cutting rates would tolerate persistently higher inflation, while aggressive hikes would likely push weak growth into contraction.
This policy impasse produces a form of financial repression: nominal yields that look attractive on paper lose much of their value once inflation is considered. With real yields compressed, the monetary case for holding non‑fiat stores of value strengthens. Gold typically benefits first; silver follows, but with the added advantage of a durable industrial demand floor that gold lacks.
Why Doesn’t Silver’s Industrial Demand Fall With the Economy?
Unlike copper or aluminum, whose demand tracks construction and manufacturing cycles closely, silver’s largest end uses are driven by long‑term structural mandates. Renewable energy targets, fleet electrification policies, and corporate decarbonization plans create a sustained need for silver in solar panels, EVs, and electronics — investments that continue through business cycles.
For example, battery‑electric vehicles require substantially more silver per vehicle than combustion models, with estimates ranging from 67–79% higher silver content per unit. These are not discretionary items that pause during a slowdown; they are infrastructure and technology investments with multi‑year horizons. That creates an industrial demand floor, limiting how far industrial consumption can fall even in weak economic periods.
Why Can’t Silver Supply Catch Up With Demand?
The structural nature of silver supply is the key constraint. Nearly 70% of mined silver is produced as a byproduct of other metals — copper, lead, zinc and gold. That means silver’s price signal alone does not spur rapid expansion of primary silver mining. New primary silver projects take years to permit and develop and are rarely profitable without robust multi‑year price support.
As a result, when demand outstrips supply, the market has to draw on above‑ground inventories rather than rely on quick production increases. According to industry surveys, the market has been in deficit for several consecutive years and has drawn down substantial stockpiles. This makes the physical market tighter and more sensitive to any increase in demand.
What Does the Gold‑Silver Ratio Tell Us Today?
The gold‑silver ratio — how many ounces of silver buy one ounce of gold — is a simple gauge of relative value between the two metals. As of early June 2026 the ratio sits near 60:1, which is close to the post‑2000 average range of roughly 60–68:1. The ratio tightened to about 46:1 in January 2026 when silver reached historic highs near $121.
Silver has since underperformed relative to gold as the market repriced inflation and rate expectations, driven in part by geopolitical events and rising energy prices. That divergence reflects the short‑term sensitivity of silver to rate expectations and industrial growth fears. But a policy pivot — either cuts induced by deteriorating growth or eventual easing after a growth slowdown — would likely trigger both a rising industrial outlook and stronger monetary demand, compressing the ratio further.
What Does This Mean for Your Silver Allocation?
For investors already holding physical silver, the case is unchanged: the structural setup favors a multi‑year time horizon rather than short‑term speculation. The combined forces of a persistent industrial demand floor, a prolonged supply deficit, and a monetary case strengthened by low real yields argue for a three to five year perspective.
For those deciding how to allocate today, consider the current gold‑silver ratio near historical averages, a widening physical deficit, and the Fed’s constrained policy path. These factors create an asymmetric risk profile: the market is tighter than recent price action implies, and a policy shift could cause both industrial and monetary demand to reprice higher simultaneously. Understanding this architecture clarifies what you hold — not as a guaranteed short‑term trade, but as exposure to structural forces that favor silver over a multi‑year horizon.
This explanation is intended to show how the market works and why silver’s dual demand dynamic matters for long‑term investors seeking financial sovereignty through tangible assets.
Stay On Top of Gold & Silver Prices
Get important market alerts sent straight to your inbox.
People Also Ask
What is stagflation and why does it matter for silver?
Stagflation is the combination of high inflation and below‑trend economic growth. It matters for silver because it is the rare condition in which both of silver’s demand drivers — industrial and monetary — can strengthen at the same time. In normal recessions monetary demand rises while industrial use falls; in normal growth phases the reverse occurs. Stagflation removes that trade‑off.
Why does silver have two separate demand drivers when gold only has one?
Gold is primarily a monetary metal with very little industrial use. Silver, by contrast, has substantial industrial consumption in addition to its monetary role. Industry applications account for a large portion of total silver demand, creating a structural floor that is linked to long‑term technology and infrastructure buildouts rather than short‑term economic swings.
What is the gold‑silver ratio today, and what does it signal?
The gold‑silver ratio is near 60:1 as of early June 2026, which places silver close to its post‑2000 average relative to gold. A compressed ratio — like the one seen in January 2026 — reflects a period when silver outperformed. The current ratio indicates that silver’s recent underperformance is more a function of short‑term rate expectations and geopolitical repricing than a collapse in its structural case.
Is silver a good investment during stagflation?
For investors with a multi‑year perspective, silver can be an attractive complement to gold during stagflation. Low or barely positive real yields strengthen monetary demand for precious metals, while structural industrial demand from solar, EVs and AI infrastructure supports consumption independent of GDP cycles. Coupled with a persistent supply deficit, these factors create a long‑term structural argument for allocation to silver.
Why can’t silver miners increase supply to meet demand?
Because most silver is produced as a byproduct of mining for other metals, higher silver prices alone do not quickly trigger significant new production. Primary silver projects require long lead times and substantial capital, so the market’s response to sustained demand often comes from drawing down inventories rather than rapid increases in mine output.
SOURCES
1. World Silver Survey 2026 (Silver Institute / Metals Focus) — industry supply and demand analysis.
2. Silver Institute reporting on global silver investment and market deficits.
3. Oxford Economics / Silver Institute research on silver content in EVs and industrial applications.
4. U.S. Bureau of Economic Analysis — Personal Income and Outlays; GDP estimates and related data.
5. U.S. Department of the Treasury / Federal Reserve data on market yields and real rates.
6. Industry price and market data for gold and silver (spot price references).
Disclaimer: This article is for informational purposes only and does not constitute financial or investment advice. Consult a qualified financial adviser before making investment decisions.
You May Also Like:
- The Buyer List for Gold Just Got Longer. These Countries Have Never Bought Before.
- PCE Hit 3.8%. GDP: 1.6%. Gold Went Up. Here’s the Mechanism.
- Gold Targets Are Falling. The $8,000 Forecast Isn’t.
- Gold Radar: 5 Stories the Price Chart Isn’t Telling You
- Silver Lost 3.3% While Gold Lost 1.6%. That Gap Is Not Random.
- Gold Down 1.2%, Silver Down 2.8% — The Floor Holds
- UBS Just Cut Its Gold Target by $400. The Part They Kept Is the Real Story.
- Why Gold Is Falling Today — And Why $4,500 Is Holding.
- Gold Is Down Today. Here’s Why Smart Money Is Still Buying.
Popular Topics
Picked from the archive
-
01
 Topics
Timing Gold and Silver Buys with Technical Analysis
-
02
Topics
Why Gold Is Holding at $4,347 While Stocks Hit Record Highs
-
03
Topics
Why Gold Holds Value: The 5,000-Year Truth Investors Miss
-
04
Topics
Gold Price: What Could Drive It to $6,300?
-
05
Topics
Banks Forecast Gold Over $5,400 After Greenland News
-
06
Topics
Gold Near Records as CPI Looms, Consumer Debt at $18.5T
-
07
Topics
Factory Cost Index Hits 82.1: Why It’s Driving Gold Prices
-
08
Topics
Market Update: Gold Steady, Shoppers Cautious, Nvidia Scrutinized