Why Silver Dropped 3.3% vs Gold’s 1.6%: The Gap Explained

Key Takeaways
- Silver’s sharper fall versus gold is structural: roughly 58% of silver demand is industrial, so when economic or geopolitical uncertainty rises, that industrial premium reverses quickly.
- Silver’s market is much thinner than gold’s, and central banks do not hold meaningful silver reserves, so there is no comparable institutional floor to cushion sell-offs.
- The silver market is in its sixth consecutive year of supply deficit (a projected 46.3 million ounce shortfall in 2026), and about 70% of new silver supply is a byproduct that cannot quickly respond to higher prices — the same features that deepen declines also magnify recoveries.
Around 58% of global annual silver demand originates in industry — solar panels, electric vehicles, data centers, medical devices and other manufacturing uses. By contrast, essentially none of global gold demand comes from factories. That single structural difference explains why silver is often more volatile and why it is falling faster than gold now.
Why is silver falling faster than gold today?
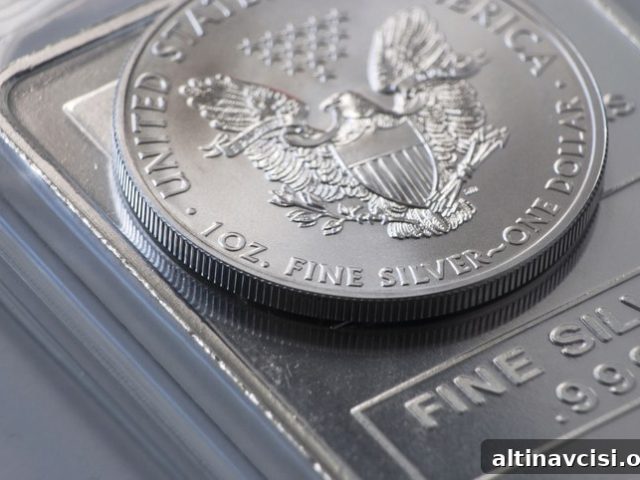
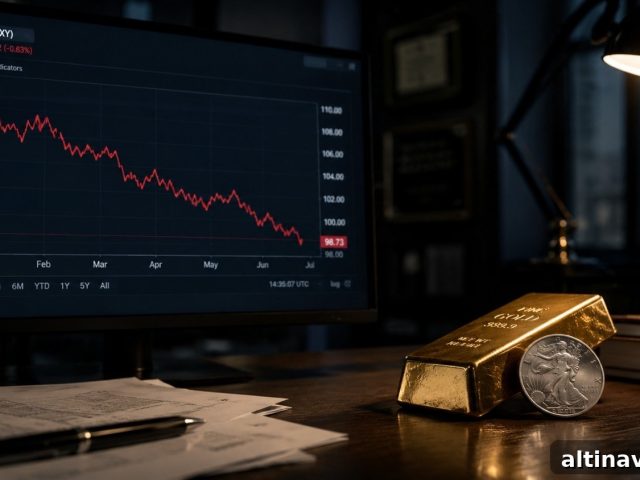
As of 11:03 a.m. ET on May 27, 2026, silver traded at $74.42 per ounce, down $2.55 (about 3.3%) on the day [nFusion Solutions, May 27, 2026]. Gold traded near $4,437, down $70 (roughly 1.6%). In short, silver is moving more than twice as fast as gold.
The immediate trigger was renewed geopolitical uncertainty in the Middle East: U.S. military strikes described as self-defense operations in southern Iran came as negotiators were discussing a 60‑day ceasefire framework. That news pushed oil higher, strengthened the dollar, and sent investors away from risk assets. Both metals fell, but silver’s fall was steeper — and that gap is explained by structure rather than randomness.
The Edge Every Investor Needs
Smarter precious-metals investing starts with context. Subscribe for concise market insights, Fed updates, and timely educational content.
Subscribe to receive market alerts and concise analysis by email.
What causes silver to drop more than gold?
The explanation is structural and can be summarized in three clear points.
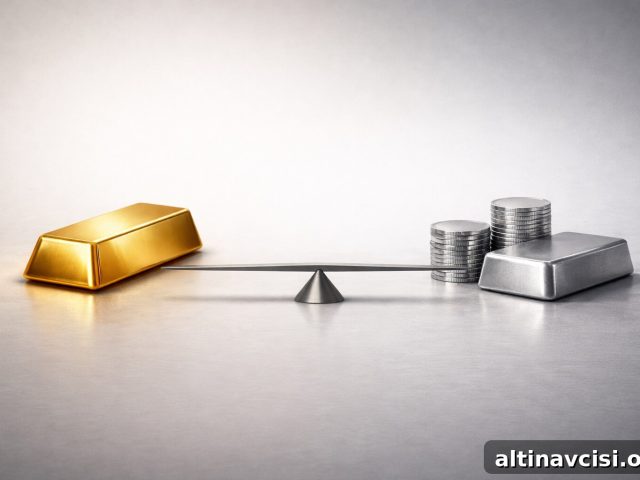
First, silver has a dual identity. Gold functions primarily as money — a store of value and a reserve asset for central banks and sovereign funds. Silver serves both as a monetary asset and an industrial metal. When geopolitical or economic risk rises, industrial buyers cut exposure quickly. That industrial portion—roughly 58% of demand—contracts, while monetary demand (the remaining ~42%) holds or strengthens. That split means industrial cycles and factory activity can swing silver’s price much more dramatically than gold’s.
Second, silver’s market is far thinner. Cleared trading volumes and market depth for gold are routinely many times larger than for silver. The same dollar amount of selling has a much larger percentage impact on silver prices. That thinner market structure causes bigger moves in silver both down and up when traders reposition.
Third, central banks do not provide a silver safety net. Central banks have been meaningful buyers of gold in recent years, creating a persistent institutional bid and a structural floor for gold prices. Silver does not enjoy that same steady central-bank support, so when broad selling occurs, there is no comparable buyer of last resort to limit downside.
What happens after silver’s biggest single-day drops?
History and supply fundamentals suggest that patience often pays for long-term investors. Analysts at the Silver Institute and Metals Focus project the market will be in its sixth straight annual supply deficit in 2026, with a shortfall of about 46.3 million ounces. That persistent deficit exists because about 70% of global silver supply is recovered as a byproduct of mining other metals (copper, lead, zinc). When silver prices fall, that byproduct supply is not responsive in the short term because producers are focused on the primary metal economics.
At the same time, above-ground inventories have been drawn down year after year, shrinking the pool of available metal. Those combined dynamics mean that price-driven increases in mining output are limited and that inventories are a diminishing buffer.
Crucially, the market’s leverage works both ways. The thin market structure that accelerates declines will also accelerate rallies when sentiment shifts — for example, if a ceasefire holds, inflation data cools, or central banks signal greater policy accommodation. In those scenarios, silver tends to lead and to move farther than gold.
Should you buy silver during a pullback?
It depends on your time horizon and objectives. For a short-term trader, today’s 3.3% drop is a market data point to trade around. For longer-term investors who understand the structural picture—six consecutive years of supply deficits, a large share of supply that can’t ramp quickly, and the dual monetary/industrial demand dynamic—pullbacks can present buying opportunities.
Keep perspective: today’s price was $74.42 per ounce; roughly a year earlier the price was near $33. That volatility reflects the metal’s nature rather than signaling a flawed case for ownership. The same features that amplify declines fuel recoveries when fundamentals or sentiment improve.
Near-term market risk remains. Upcoming U.S. data—Q1 GDP second estimate, PCE inflation, and weekly jobless claims—could push metals lower if the numbers are hotter than expected. If data softens or geopolitical tensions ease, silver’s rebound could be swift. Understanding these drivers lets you make deliberate allocations rather than reacting to headlines.
Owning an asset is a form of financial sovereignty when you understand its fundamentals and can hold through volatility.
Stay On Top of Gold & Silver Prices
Get important market alerts sent straight to your inbox.
Live price widget removed for a cleaner reading experience. Subscribe for timely updates.
SOURCES
1. nFusion Solutions — Live Spot Price Data, May 27, 2026
2. Silver Institute / Metals Focus — World Silver Survey 2026
3. World Gold Council — Gold Demand Trends Full Year 2025: Central Banks
4. GoldSilver.com — Silver Price Crash History: What Happens After the Biggest Drops?
5. GoldSilver.com — Silver Industrial Demand: Solar, EVs, and the Supply Gap
Disclaimer: This article is for informational purposes only and does not constitute financial or investment advice. Always consult a qualified financial adviser before making investment decisions.
You May Also Like:
- Gold Down 1.2%, Silver Down 2.8% — The Floor Holds
- UBS Just Cut Its Gold Target by $400. The Part They Kept Is the Real Story.
- Why Gold Is Falling Today — And Why $4,500 Is Holding.
- Gold Is Down Today. Here’s Why Smart Money Is Still Buying.
- Silver Up 3%. Gold Up 1.3%. The Ratio Tells You Everything.
- Iran News Sent Gold Price Both Ways. The Driver Was Never Iran.
- Gold Falls 0.5% on Iran Deal: The Floor Holds
- Is Gold Being Repriced? 5 Major Institutions Say Yes.
Popular Topics
Picked from the archive
-
01
 Topics
Stronger Economy Delays Rate Cuts, Pressures Bond Market
-
02
Topics
Gold Price Rebounds Amid Iran Tensions, Fed Moves, Dollar Surge
-
03
Topics
401(k) Rollover to a Gold IRA: Step-by-Step Guide
-
04
Topics
Silver Slides While Gold Holds as Markets Reduce Risk
-
05
Topics
Gold Price Tops $3,600 After $1,000 Rally This Year
-
06
Topics
Gold Prices Rise on Fed Policy, Debt Concerns and Asian Demand
-
07
Topics
Gold vs Silver: Liquidity Explained for Investors
-
08
Topics
Dollar’s Decline: What It Means for Gold and Silver