Gold Price Falls After Retail Sales Signal No Fed Rate Cut
Gold opened lower this morning at $4,016, while silver fell to $56.28 — marking its steepest single-session drop in over a week. The moves came after the U.S. Census Bureau released the June retail sales report at 8:30 AM ET, and the underlying details in that report reversed a key data trend that has pressured gold all year.
On the surface, the June retail sales headline looked modestly positive: total sales rose 0.2% from May. But the composition of that change matters. Receipts at gasoline stations plunged 5.3% in June, the largest monthly decline in the release. Remove gasoline sales from the totals and retail receipts actually rose 0.7%. Strip out both gasoline and auto sales, and the core control group — the measure the Federal Reserve watches closely to assess consumer demand — increased a healthy 0.4% for the month.
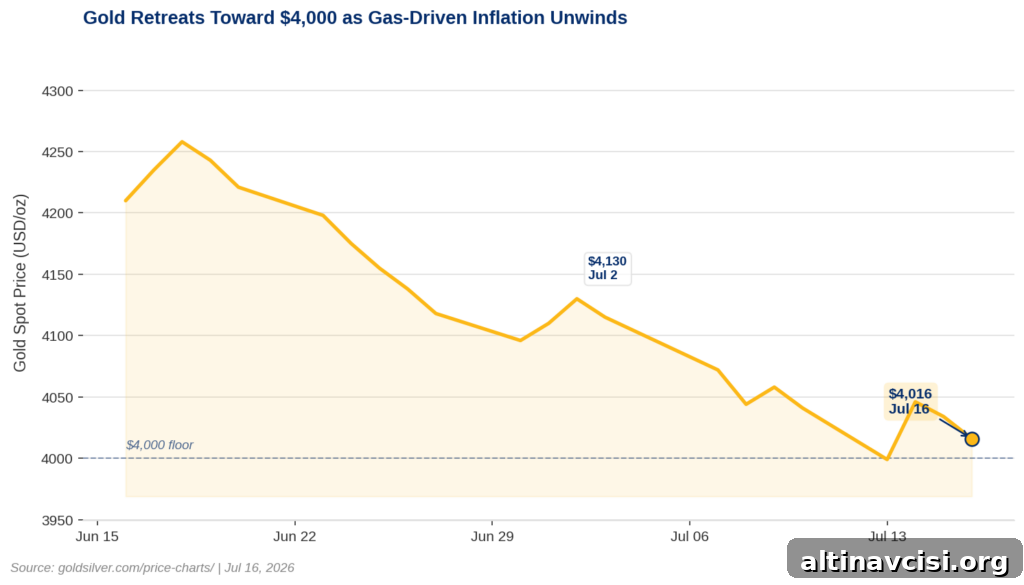
The takeaway is straightforward: the American consumer is still spending. That fact has material implications for gold, and it helps explain why bullion remains under pressure despite recent disinflation headlines.
Why Does Retail Sales Data Move Gold Prices?
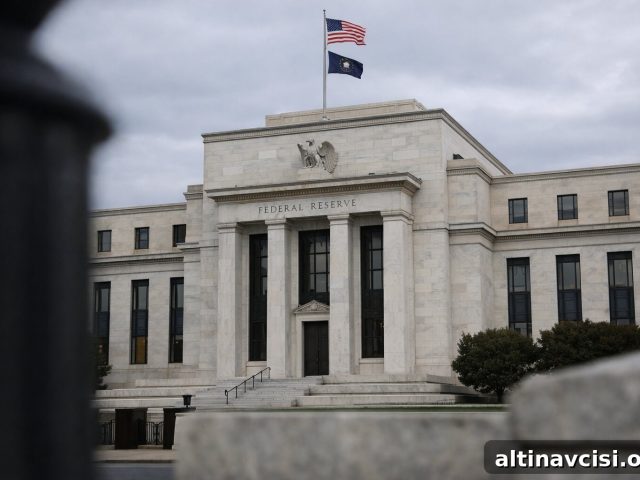
The link between retail sales and gold runs primarily through monetary policy. Strong consumer spending reduces the need for near-term Federal Reserve rate cuts and can even keep the door open for further tightening. The federal funds rate currently stands at 3.50%–3.75%, and the recent FOMC projections showed a divided committee: roughly half of members still saw the potential for at least one hike before year-end, while the remainder projected no change.
Gold does not yield interest. When real interest rates — the return on cash and bonds after adjusting for inflation — remain elevated, holding gold carries a visible opportunity cost compared with yield-bearing assets. That dynamic tends to cap gold’s upside even as headline inflation declines.
Today’s retail sales detail reinforces the view that the Fed does not need to rush into easing. A resilient consumer weakens the near-term case for rate cuts, keeping real yields relatively high and sustaining downward pressure on gold prices.
The Edge Every Investor Needs
Smarter precious metals investing starts with clear, timely insight. Our newsletter delivers market context, Fed briefings, global trends, and education tailored to precious-metals investors.
Subscribe for concise market alerts and analysis sent to your inbox.
What the Gas Pump Was Hiding
A second, often-overlooked element is how volatile gasoline receipts have amplified month-to-month retail and inflation readings this year. From March through May, gasoline-station receipts jumped 15.5%, 2.8%, and 3.4% month over month as geopolitical tensions — including U.S. strikes in the Middle East and concerns about the Strait of Hormuz — drove oil prices higher. Those energy-related gains fed into headline retail sales and simultaneously pushed consumer price inflation higher, lifting CPI from 2.4% in February to 4.2% by May.
That short-term oil-to-CPI pipeline shifted expectations for Fed policy. Rising energy-driven inflation increased the odds of further tightening last fall and was a major factor in gold’s correction earlier in the year, which briefly took bullion from $5,589 in January to below $4,000 last week.
Now the pipeline has begun to reverse. June CPI fell 0.4%, the largest monthly decline since April 2020, as a temporary ceasefire and easing energy prices reduced consumer price pressure. June producer prices also cooled, dropping the year-over-year PPI from 6.5% to 5.5%. In that context, a 5.3% decline in gasoline-station receipts in June is consequential: it means some of the inflation spike that drove market and Fed expectations was transitory and tied to volatile energy costs.
Still, the fading of this energy shock does not automatically translate into looser policy. Absence of a new tightening impulse is not the same as justification for cuts. The Fed’s current stance — effectively on hold — implies elevated real yields compared with a scenario in which the central bank moves decisively to ease. Elevated real yields remain a headwind for gold even as the specific inflation drivers shift.
Is the Fed Done? Two Dates Will Decide.
Two upcoming data points are likely to shape gold and silver’s near-term trajectory. First, the Federal Open Market Committee meets July 28–29; the language in Chair Kevin Warsh’s post-meeting remarks — and any adjustments to the committee’s dot-plot or forward guidance — will influence markets. Second, the June PCE report, the Fed’s preferred inflation gauge, is scheduled for July 30. That release will be the critical check on whether the energy-driven disinflation evident in CPI and PPI is also visible in the broader personal-consumption expenditures measure.
If PCE prints softer than expectations, it would reduce odds of another rate hike and could open the door for gold to reclaim levels above $4,100, a threshold cited by some analysts as an important step toward higher targets. Conversely, a resilient PCE reading would reinforce the Fed’s current posture and likely extend pressure on both metals.
For investors with a long horizon, the structural argument for gold has not changed: central banks continued to buy into the correction earlier this year, and long-term monetary and fiscal dynamics remain supportive for bullion as a store of value. But in the short term, today’s retail sales detail reinforces the message that the Fed’s job is not yet complete — and gold prices are reflecting that reality.
See live gold and silver prices at goldsilver.com/price-charts/.
Stay On Top of Gold & Silver Prices
Get important market alerts and concise analysis delivered to your inbox.
Subscribe to receive timely alerts and market commentary on gold and silver.
SOURCES
1. U.S. Census Bureau — Advance Monthly Sales for Retail and Food Services, June 2026 (CB26-113, July 16, 2026).
2. Bureau of Labor Statistics — Consumer Price Index — June 2026 (USDL-26-1191, July 14, 2026).
3. Bureau of Labor Statistics — Producer Price Index — June 2026 (July 15, 2026).
4. Federal Reserve — FOMC Statement and Summary of Economic Projections, June 17, 2026.
5. GoldSilver — Live Gold and Silver Spot Prices, July 16, 2026.
Disclaimer: This article is for informational purposes only and does not constitute financial or investment advice. Consult a qualified financial adviser before making investment decisions.
You May Also Like:
- Silver Dropped 1.4% Today. Gold Didn’t. The Ratio Just Hit 70:1.
- Gold Holds as CPI and PPI Both Miss. Here’s Why.
- Gold Is Flat. Oil Is Up 9%. Here’s Why.
- Gold and Fed Policy: When the System Picks Winners
- Warsh Testified. Gold Jumped $90. The Signal Everybody Missed Was in His Report.
- Gold Jumped $90 This Morning. June CPI Just Explained Why.
Popular Topics
Picked from the archive
-
01
 Topics
Gold Price Cycles Explained: A Four-Time-Horizon Framework
-
02
Topics
Gold Repricing Underway: 5 Major Institutions Confirm
-
03
Topics
How Dalio, Buffett and Jim Rogers Invest in Gold
-
04
Topics
How Gold Prices Move During a US Dollar Crash
-
05
Topics
5 Factors That Drive Gold Spot Prices
-
06
Topics
August CPI: Sticky Inflation Unlikely to Stop Fed Rate Cuts
-
07
Topics
Institutions Are Buying as Bond Yields Rise: What It Means
-
08
Topics
Why a Stalled Federal Reserve Matters for Gold Prices