Gold Price Cycles Explained: A Four-Time-Horizon Framework
Key Takeaways
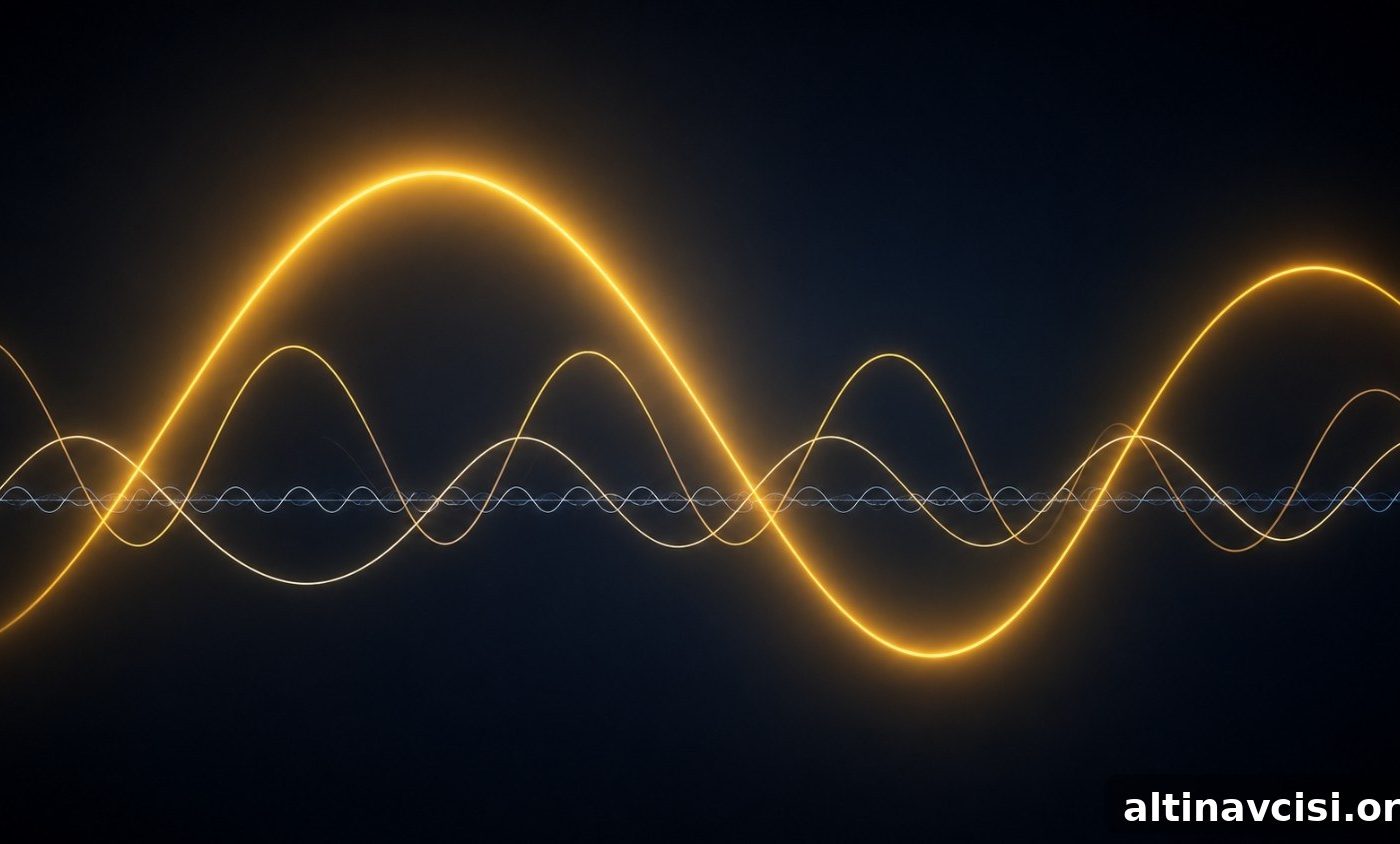
- Gold moves within four overlapping cycles: long structural waves (roughly 40–60 years), a medium-term monetary cycle (~16 years), the business cycle (about 7–8 years), and a repeatable annual seasonal pattern.
- Three quantitative frameworks — the Real Yield Model, the M2 Money Model, and the Dow/Gold Ratio — offer the clearest way to evaluate where any gold cycle stands.
- By mid‑2026, gold traded near $4,100/oz after retreating from a January 28, 2026 intraday peak near $5,589/oz. Structural drivers for the current bull phase — negative real yields, record central bank purchases, and a declining Dow/Gold ratio — remain intact.
- Seasonal analysis over five decades shows late June through early July is typically the weakest period for gold, while August through February is the strongest seasonal window — and mid‑2026 sits at that turning point.
- Understanding cycle positioning does not forecast next week’s price. It does show whether the structural forces that sustain multi‑year bull markets remain in place — and they do at present.
Gold price cycles are the layered, recurring patterns that drive expansions and contractions in gold’s market value. These cycles span different time frames — from annual seasonal demand to multi‑decade structural waves — and are shaped by real interest rates, broad money growth, institutional reserve flows, and physical demand. Knowing each cycle helps investors distinguish short‑term noise from durable trends.
Gold doesn’t move at random. Its price reflects overlapping rhythms: long structural shifts between paper and tangible assets, monetary regimes that influence purchasing power, business cycle dynamics that affect risk appetite, and seasonal buying tied to jewellery and cultural demand. In mid‑2026, with gold near $4,100/oz after a pullback from an intraday record, mapping all four cycles is a practical way to assess risk and opportunity.
This article lays out the four cycle types, explains the three key valuation models that track them, and places the current environment in context so you can better judge the likely durability of the ongoing gold market trend.
What Are the Major Long-Term Gold Price Cycles?
At the longest horizon, gold follows multi‑decade structural cycles. Two primary long waves appear in the historical record.
The first is a long economic wave spanning roughly 40–60 years, reflecting generational shifts in preference between financial paper and tangible assets. Research connecting metal prices to Kondratiev‑style long cycles finds meaningful synchronization between commodity upswings and these long economic arcs. The practical market gauge for this structural cycle is the Dow/Gold ratio: when the ratio compresses significantly, hard assets gain relative purchasing‑power appeal.
The second structural cycle, about 16 years on average, is driven mainly by real interest rates. When real yields are deeply negative, the opportunity cost of holding non‑yielding gold collapses and capital tends to flow into physical assets, producing extended bull markets. Conversely, sustained periods of high positive real yields have historically produced lengthy gold bear markets.
Both mechanisms — generational shifts and the real‑yield environment — explain why gold can outperform over decades even as it undergoes substantial corrections along the way.
The Knowledge That Changes Everything
Two concise guides, free: one explains practical gold buying, the other outlines the long-term weaknesses of fiat currencies.
How Does the 7–8 Year Business Cycle Affect Gold?
Gold typically reacts to the intermediate business cycle in a recognizable way. During rapid economic expansions, rising real yields and strong equity returns reduce demand for a non‑yielding asset like gold. When the corporate debt cycle turns and growth slows, gold often performs counter‑cyclically as investors seek alternative stores of value.
From 2003 through roughly 2022, the inverse relationship between gold and real yields was strong — historically showing a high negative correlation. When real yields moved toward zero or negative territory, gold tended to rise; when real yields climbed, gold faced pressure. That pattern helps explain extended consolidations when policymakers signaled tighter policy and real rates rose.
More recently, the dynamic has become more complex because central banks emerged as large, consistent buyers. Central bank reserve purchases are driven by diversification and geopolitical strategy rather than short‑term yield comparisons. As a result, real yields remain important, but they now interact with an elevated institutional demand floor that can mute or reshape traditional business‑cycle responses.
Central banks purchased hundreds of tonnes annually in the early 2020s, and survey data indicates a significant percentage of institutions intend to increase gold reserves. That structural demand has become a meaningful price support distinct from retail ETF flows.
What Is the 4-Year Presidential Election Cycle for Gold?
Gold also displays a modest response to the U.S. four‑year election cycle. Historically, presidential election years have shown muted gold returns as markets await clarity on fiscal direction, while midterm years have often produced stronger price performance.
Over recent decades, midterm years have averaged higher returns for gold than presidential years. The effect likely stems from shifting expectations about fiscal policy and deficit trajectories: once election outcomes create more policy certainty, capital reallocates based on anticipated fiscal and monetary stances.
That said, the political cycle is the weakest of the four in predictive power. It provides a marginal signal to timing, not a primary driver over long horizons.
What Is the Annual Seasonal Pattern for Gold?
Seasonality is the most actionable short‑term cycle. Physical gold demand follows cultural and institutional calendars, producing reliable seasonal patterns that have held across decades.
Across 50 years of data, gold’s strongest months tend to be September, January, and November, while March, April and June are commonly weaker. Jewellery demand — driven by Indian wedding and festival seasons, Chinese New Year, and holiday periods — accounts for much of this seasonality.
Statistically, June is frequently the weakest month, with July and August showing recovery and the primary seasonal rally running roughly from August through February. That makes late summer an important tactical turning point for allocating into gold ahead of higher‑demand months.
In mid‑2026, gold sits at this seasonal inflection: the summer trough wanes and the historically stronger autumn‑to‑winter buying window approaches, creating a favorable tactical backdrop within a still‑supportive structural environment.
What Is the Real Yield Model for Gold?
The Real Yield Model compares gold to the real (inflation‑adjusted) return on 10‑year TIPS. Because gold pays no income, its attractiveness depends heavily on the opportunity cost of foregoing a real bond return.
When real yields are positive and materially elevated, investors prefer yield‑bearing assets; when real yields fall to zero or below, the opportunity cost of gold diminishes and demand rises. Historically this relationship is strong: falling real rates have supported multi‑year gold advances, while rising real rates have been gold’s main structural headwind.
In recent years, central bank buying has at times softened the typical sensitivity to real yields, but the TIPS yield remains a key signal for medium‑term accumulation decisions.
What Is the M2 Money Model for Gold?
The M2 Money Model links gold’s long‑run path to the growth of the broad money supply. In fiat systems, currency units can expand quickly while mined gold cannot, so over decades gold often preserves purchasing power against monetary expansion.
Since the end of Bretton Woods in 1971, broad money has grown markedly. While gold diverges from M2 growth in certain decades — especially when real yields are high — the long‑term relationship supports gold as a hedge against monetary debasement. Current fiscal dynamics, including elevated sovereign debt levels and rising interest costs, constrain the plausibility of prolonged, durable real‑rate tightening, which bolsters the long‑run case for gold under the M2 framework.
What Is the Dow/Gold Ratio and Why Does It Matter?
The Dow/Gold ratio measures how many ounces of gold equal the Dow Jones Industrial Average. It’s a simple, intuitive gauge of whether financial paper or hard assets are currently favored by the market.
Historically, extreme lows in the ratio marked decisive turns toward gold, while extreme highs signaled extended equity dominance. A decline in the ratio over several years indicates a structural rotation into hard assets; as of mid‑2026 the ratio sits well below its long‑term extremes, confirming a multi‑year shift that remains in progress.
Where Does the Current Gold Price Cycle Stand in Mid-2026?
As of July 10, 2026, gold traded around $4,100/oz after a roughly 27% pullback from an intraday record in January 2026. That correction fits within historical mid‑cycle consolidation ranges for secular bull markets, which have often seen significant retracements without ending the broader trend.
Viewed through the four frameworks:
- Long‑wave structural cycle: The Dow/Gold ratio’s decline from recent highs signals ongoing accumulation in hard assets. The structural conditions that typically end bull markets — sustained high real yields and credible fiscal tightening — are not present.
- Monetary cycle: The Federal Reserve’s rate easing through 2024–2025 reduced policy rates and kept real yields compressed, a regime that historically supports gold. Central bank purchases remain elevated, adding a durable institutional bid.
- Business cycle: Slowing growth and an easing Fed imply credit conditions have begun to soften, a late‑cycle environment where gold often strengthens.
- Seasonal cycle: Mid‑July lies at the seasonal trough; the following months historically represent gold’s strongest period of the year.
These frameworks do not prescribe precise prices, but together they describe an environment historically consistent with continued multi‑year bulls rather than immediate cycle endings.
What Are the Key Risks That Can Disrupt Gold Price Cycles?
Three risks have historically ended gold bull markets or triggered prolonged weakness.
The Real Yield Trap. A sustained, credible tightening that pushes real yields well into positive territory (historically above 3–4%) undermines gold’s appeal. The modern example is the late‑1970s/early‑1980s rate surge that produced a nearly two‑decade bear market.
Safe‑Haven Liquidity Events. In acute liquidity crises, investors sometimes sell gold alongside other assets to raise cash, producing short‑term selloffs. These episodes can be sharp but have historically proved transitory, with gold often recovering to new highs.
Sovereign Demand Reversal. The recent institutional floor under gold stems from large central bank purchases. If major central banks shifted from net buying to sustained net selling, that structural support would weaken. Current data as of 2026 indicates continued net buying from many institutions, but a reversal would be a critical risk to monitor.
Stay On Top of Gold & Silver Prices
Get important market alerts sent straight to your inbox.
People Also Ask
What drives long-term gold price cycles?
Long‑term gold cycles are mainly driven by real interest rates, money supply expansion, and generational shifts between confidence in paper assets versus tangible stores of value. When real yields are negative, gold becomes more attractive because bonds lose purchasing power. Central bank reserve policy, geopolitical stress, and currency shifts are important secondary drivers.
How long do gold bull markets typically last?
Modern gold bull markets have averaged roughly 9–10 years. The 1970s cycle and the 2001–2011 bull run are examples. The current structural cycle in the 2018–2026 window is about 7–8 years old, meaning it remains younger than many prior major cycles when they peaked.
What is the difference between a gold cycle and a gold price correction?
A correction is a temporary pullback — often 10–30% — inside an ongoing bull market. A cycle end requires a reversal of structural conditions: sustained high real yields, meaningful central bank selling, and a contracting money supply. Distinguishing corrections from cycle endings prevents premature decisions during normal market volatility.
How does gold seasonality interact with the broader cycle?
Seasonality provides short‑term timing context within broader cycles. The weakest months tend to cluster in late spring and early summer, while the strongest months run from late summer through winter. When seasonal strength aligns with favorable macro conditions, it often offers a tactically advantageous window to add to long‑term positions.
What does the Dow/Gold ratio tell investors about where we are in the cycle?
The Dow/Gold ratio shows how many ounces of gold equal the Dow. High readings suggest equities have been favored and a rotation toward hard assets may be overdue; low readings indicate extreme gold strength relative to stocks. Current mid‑cycle readings reflect an ongoing shift toward hard assets, not its completion.
How should long-term investors use gold cycle analysis without trying to time the market?
Use cycle analysis as a structural guide rather than a short‑term timing tool. Follow indicators like real yields, M2 growth, and the Dow/Gold ratio to assess whether the macro conditions that support long bull markets persist. Use seasonal patterns to find tactically favorable entry points. Avoid treating routine corrections as signals to abandon a long‑term allocation unless the structural drivers have clearly reversed.
Are gold price cycles predictable enough to trade on?
Cycles provide probabilistic guidance but not precise timing. Structural indicators offer directional context for multi‑year allocation decisions, while seasonality adds monthly granularity. Relying on cycle analysis for short‑term trading carries risk because even historically strong months are not positive every year. Cycle analysis is most valuable for long‑term positioning and risk management.
What This Means for Long-Term Precious Metals Investors
The four‑cycle framework does not predict next month’s price, but it reveals whether the structural forces that sustain multi‑year bull markets are intact. In mid‑2026, three of the four frameworks align in a way historically favorable for long‑term gold holders: structural rotation into hard assets, compressed real yields, and elevated central bank demand. The seasonal trough in early July often precedes gold’s strongest months, making the next half‑year historically favorable for accumulation.
Long‑term investors should use the framework to remain confident in structural allocation decisions and to identify tactical windows for adding positions, rather than trying to time short‑term swings.
SOURCES
1. World Gold Council — Gold Demand Trends Q1 2026
2. World Gold Council — Gold Outlook 2026
3. Federal Reserve / FRED — 10‑Year TIPS Yield (DFII10)
4. Federal Reserve — FOMC Rate Decisions 2025–2026
5. MacroTrends — Dow to Gold Ratio: 100‑Year Historical Chart
6. Marañon, M. & Kumral, M. (2019) — Kondratiev Long Cycles in Metal Commodity Prices, Resources Policy
7. State Street Global Advisors — Gold 2026 Outlook
8. Interactive Brokers / Seasonax — The 4‑Year Cycle and Gold
9. Seasonax — Gold Performance Over the Year and the Month (50‑Year Analysis)
10. Discovery Alert — Summer Seasonality Patterns in Gold and Silver (2026)
11. LongtermTrends — Gold vs. Real Yields; Dow/Gold Ratio updates
12. GoldSilver — Live Gold & Silver Price Charts
13. US Treasury Fiscal Data — Debt to the Penny (as of July 2026)
Disclaimer: This article is for informational purposes only and does not constitute financial or investment advice. Consult a qualified financial adviser before making investment decisions.
You May Also Like:
- The $300 Billion Lesson: What Frozen Reserves Taught Central Banks About Gold
- How To Perform Silver Technical Analysis (in 5 Steps)
- Who Controls the Gold Market? Meet the Five Banks That Settle Every Ounce
- How the Jobs Report Moves Gold and Silver: The Five‑Step Chain Behind Every Move
- What Is Profit Booking in Gold and Silver? The Mechanism Explained
- Gold Technical Analysis: A Complete Investor’s Guide
- The Anatomy of a Premium: Why Gold and Silver Never Trade at Spot
Popular Topics
Picked from the archive
-
01
 Topics
Why Silver Falls More Than Gold and What It Means for Investors
-
02
Topics
CPI-Adjusted Silver vs Spot Price: What the Ratio Reveals
-
03
Topics
Gold’s Bull Run: Fed Rate Cuts and China Buying Drive $5K Target
-
04
Topics
Gold and Silver Prices Jump After Iran Peace Deal, Then Retreat
-
05
Topics
Why Trump’s Hormuz Toll Raised Inflation and Pushed Gold Down
-
06
Topics
Thursday PCE Drop: How It Affects Gold Prices
-
07
Topics
Silver Shortage Looms as Solar and EV Demand Soars
-
08
Topics
Gold Holds After CPI and PPI Miss: Market Impact Explained