Why Silver Falls More Than Gold and What It Means for Investors
Gold and silver market update — May 14, 2026
Key Takeaways
- On May 14, 2026, silver fell far more sharply than gold because it depends on two demand drivers — industrial use and monetary/investor demand — and a sudden triple inflation shock repriced the industrial component.
- April wholesale inflation (PPI) printed 6% year-over-year, the strongest since December 2022, reinforcing that Fed rate cuts are unlikely in 2026 and pressuring silver’s industrial premium.
- Silver’s structural supply deficit — estimated at 46.3 million ounces for 2026 by the Silver Institute — remains intact. The long-term thesis for silver ownership is unchanged.
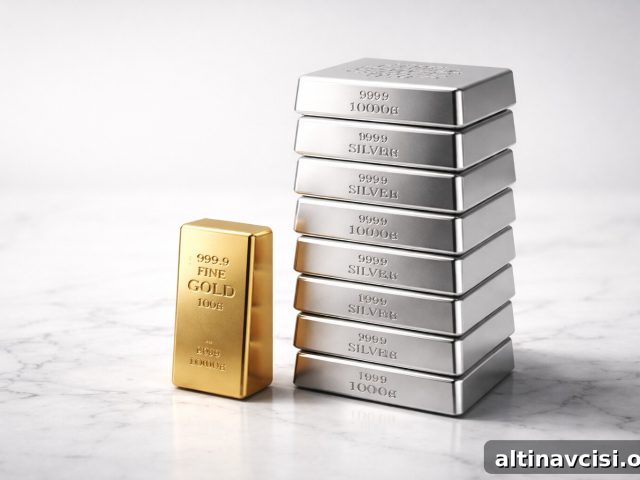
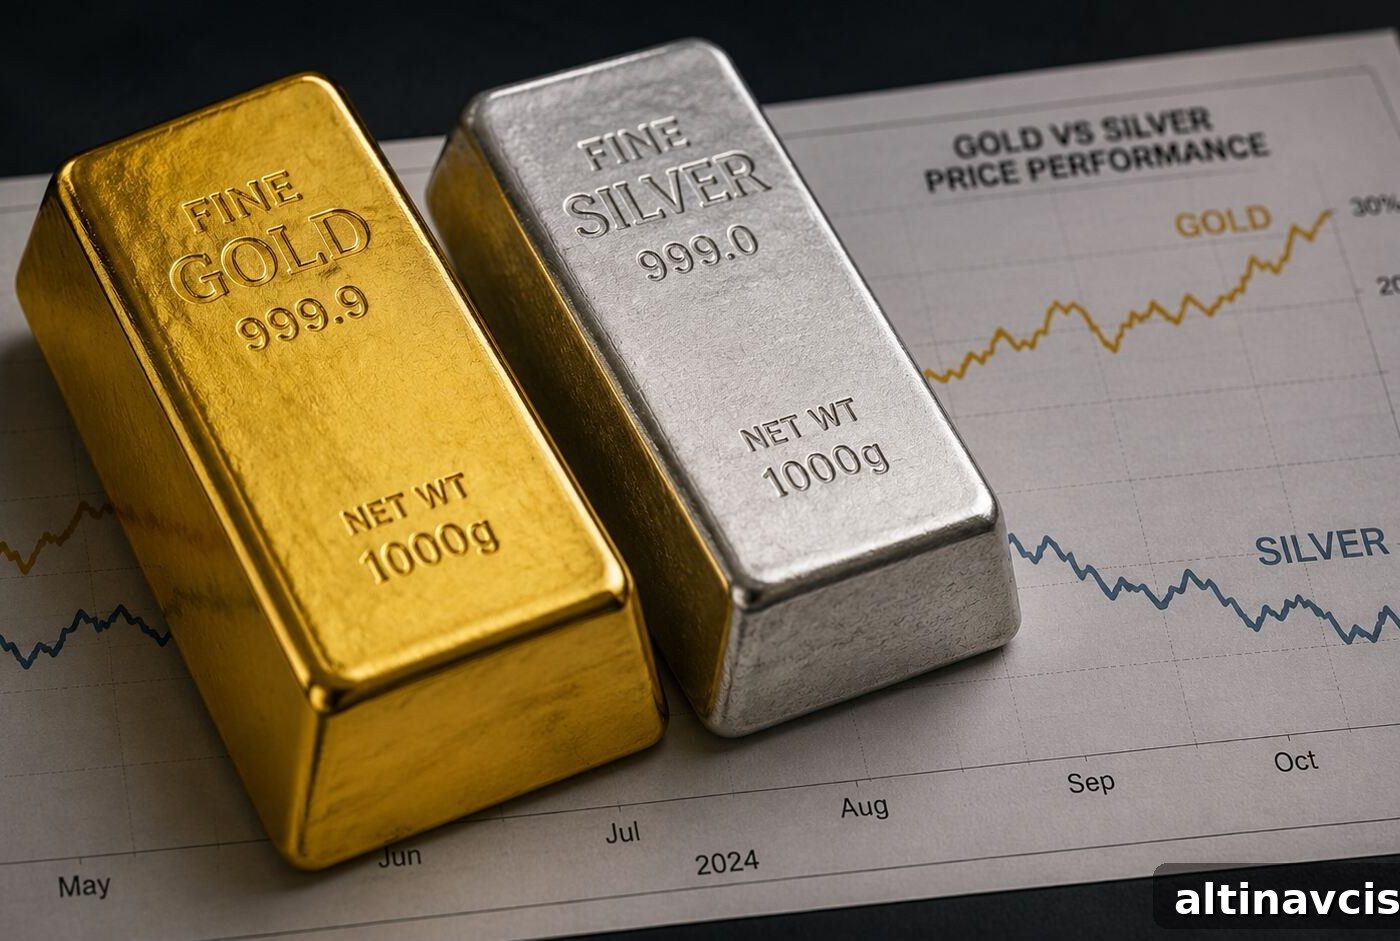
Silver peaked at $88.48 on the morning of May 14, 2026 — its highest level in two months — but by early afternoon it had slipped to $84.55, a drop of nearly $4. Gold, by comparison, fell by less than one-third of one percent. This stark contrast highlights an important dynamic: silver’s dual role in the economy makes it more volatile on days when rate expectations and the dollar move sharply.
Why Does Silver Drop So Much More Than Gold?
Silver serves two distinct markets. Roughly 55% of annual silver demand is industrial — solar panels, electric vehicles, semiconductors, medical applications and other manufacturing uses — while the remaining 45% is investor and monetary demand, the same basic driver for gold. Gold is overwhelmingly driven by investor and monetary demand, which is why it tends to move more steadily when macro headlines shift.
When markets suddenly price in higher interest rates or a stronger dollar, the industrial side of silver’s demand is the first to feel the strain. Higher rates generally slow manufacturing and capital spending. A stronger dollar raises the local-currency cost of silver for overseas buyers. Together, these forces can quickly compress the industrial premium embedded in silver’s market price, leading to outsized intraday moves compared with gold. That combination explains the price action on May 14.
The Edge Every Investor Needs
Smarter precious metals investing starts here. The Nuggets Newsletter delivers timely market insights, Fed updates, global trends and educational content directly to your inbox.
What Killed Rate-Cut Hopes This Week?
A string of stronger-than-expected economic reports over three days removed the near-term prospect of Federal Reserve rate cuts.
Tuesday’s Consumer Price Index showed US inflation at 3.8% year-over-year for April, the strongest reading since May 2023. Wednesday’s Producer Price Index — which measures wholesale inflation and often precedes consumer prices — rose 6% year-over-year, the largest annual increase since December 2022. The monthly PPI reading printed 1.4%, nearly three times the consensus forecast. Finally, April retail sales were up 0.5% month-over-month, removing an obvious recession narrative that could have pushed the Fed toward easing.
Energy costs were a major contributor to the PPI surprise: gasoline prices jumped significantly in April and accounted for much of the goods-price increase. Service-sector prices also rose sharply on a monthly basis, signaling broad-based inflationary pressure. Taken together, these reports convinced markets that rate cuts are off the table for now, which pushed the dollar higher and put further pressure on silver’s industrial valuation.
Does Any of This Change the Case for Owning Silver?
No. The short-term price move does not overturn the longer-term case for holding physical silver.
The same inflation data that temporarily hurt silver’s industrial demand actually reinforces the monetary argument for owning precious metals. Wholesale inflation at 6% is a clear signal that the dollar’s purchasing power is eroding. Physical metals are a traditional hedge against loss of purchasing power, and higher inflation readings strengthen that rationale.
At the same time, leadership at the Fed just changed. Kevin Warsh was confirmed as Fed chair in a close Senate vote and inherits a difficult environment: inflation remains too high for immediate cutting, while supply shocks — notably disruptions to oil flows — present persistent inflationary risks that monetary policy alone cannot fully resolve. With the Fed constrained, assets held outside the financial system, like physical metals, often retain value better over time.
What the Gold-to-Silver Ratio Is Telling You
The gold-to-silver ratio measures how many ounces of silver are required to buy one ounce of gold. This spring the ratio dropped from above 60 to below 55 as both investor and industrial demand pushed silver higher. On volatile days it can reverse quickly, but that movement is a feature of silver’s dual role rather than a failure of its long-term outlook.
Importantly, industry data continues to show a structural deficit in silver supply. The Silver Institute’s World Silver Survey 2026 estimated a supply gap of 46.3 million ounces for the year — the sixth consecutive year the world has consumed more silver than it mined. That kind of structural imbalance is a long-term force that plays out over months and years, not in a single afternoon’s price swing.
In short, silver is more volatile than gold because it carries both industrial and monetary demand. On days when rate expectations and the dollar shift sharply, silver will often move farther. That volatility does not negate the underlying thesis; it is how the thesis operates in real time.
Stay On Top of Gold & Silver Prices
Get important market alerts sent straight to your inbox.
SOURCES
1. nFusion Solutions — Live precious metals feed, May 14, 2026
2. U.S. Bureau of Labor Statistics — Consumer Price Index Summary, April 2026
3. U.S. Bureau of Labor Statistics — Producer Price Indexes, April 2026
4. CNBC — PPI Inflation Report, April 2026
5. U.S. Census Bureau — Advance Monthly Sales for Retail and Food Services, April 2026
6. CME Group — Fed rate expectations, May 14, 2026
7. ICE Benchmark Administration — U.S. Dollar Index (DXY), May 14, 2026
8. CNN Business — Kevin Warsh confirmed as Fed Chair, May 13, 2026
9. International Energy Agency — Oil Market Report, April 2026
10. Silver Institute — World Silver Survey 2026
Disclaimer: This article is for informational purposes only and does not constitute financial or investment advice. Always consult a qualified financial adviser before making investment decisions.
You May Also Like:
- Gold Near $4,700: The Chaos Isn’t a Ceiling. It’s a Floor
- 5 Forces Shaping Gold and Silver at the Beijing Summit
- The Real Reason Gold Falls When Inflation Surges
- CPI Hits 3.8%. Gold Falls. The Mechanism Nobody Explains
- Why the Gold Silver Ratio Is Falling — and What It Means
- What’s Moving Gold Prices This Week: CPI, Seoul & Beijing
- Silver Jumps 6% Before Trump-Xi Summit. Here’s Why
- April Jobs Beat 115K. Gold Held. The Dollar Didn’t. Here’s Why
Popular Topics
Picked from the archive
-
01
 Topics
Trump Imposes 25% Tariff on India’s Oil Imports From Russia
-
02
Topics
Gold Silver Ratio Forecast: Buy Gold, Add Silver or Wait?
-
03
Topics
WGC Q1 2026: Asian Insights Wall Street Overlooks
-
04
Topics
Silver Market Rally 2025: Should You Take Profits Now?
-
05
Topics
Store Gold at Home Securely: Safes, Security and Insurance
-
06
Topics
Treasury Yields Flat Amid Jobs Slump and Trump Policy Chaos
-
07
Topics
Outcrop Silver Bonanza: 1,877 g/t at Colombia’s Morena Vein
-
08
Topics
Gold Rises Ahead of Crucial US Inflation Report