World Bank Predicts Precious Metals Prices to Rise 42% This Year
Key Takeaways
- The World Bank forecasts precious metals prices to rise 42% in 2026 — the strongest gain among major commodity groups
- Gold and silver reached record highs in Q1 2026, propelled by a Middle East energy shock, rising inflation, and increased central bank buying
- Silver is expected to deliver larger percentage gains than gold, supported by a sixth consecutive year of physical market deficits

Your Gold Buying Guide Many investors overpay when they buy gold — and again when they sell. This guide explains what to own and why, with practical tips to help you avoid common mistakes.
Why Is the World Bank Forecasting a 42% Surge in Precious Metals?
The World Bank’s April 2026 Commodity Markets Outlook projects a 42% increase in its precious metals price index versus 2025 averages, making precious metals the strongest-performing commodity category in the forecast. That outlook is backed by several structural factors — not short-term speculation — including an unprecedented energy supply shock, renewed inflationary pressure, stagflation risk, and growing central bank accumulation.
1. A historic energy shock from the Middle East conflict
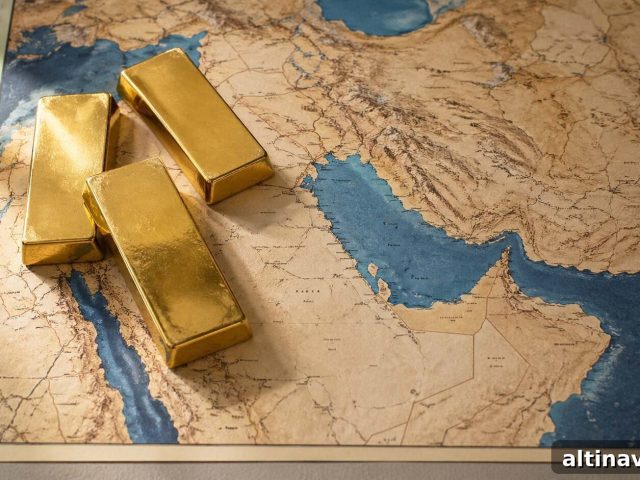
Disruptions to shipping through the Strait of Hormuz — which handles a substantial share of seaborne crude — produced the largest recorded oil supply shock in recent memory. Initial losses to global crude availability were on the order of millions of barrels per day, pushing Brent crude from the low $70s at the end of February to well over $100 by the end of March. Natural gas and LNG benchmarks also spiked sharply. Energy price shocks feed into higher consumer prices, erode confidence in fiat currency, and typically drive flows into gold as a store of value.
2. A global inflation resurgence
Developing economies are expected to see inflation notably above earlier projections, while advanced economies such as the United States have experienced a rebound in consumer prices. When inflation runs persistently above central bank targets, real returns on cash and fixed-income assets weaken. Gold’s appeal as an inflation hedge is rooted in its lack of counterparty risk and its long history of preserving purchasing power, while mine production typically grows only modestly year over year.
3. Is the US economy heading toward stagflation?
Stagflation — slowing growth combined with rising inflation — creates a difficult environment for traditional portfolios: equities face earnings pressure, and bonds lose real value. Recent data show modest GDP growth alongside higher inflation readings, a mix that increases downside risk for risk assets and enhances the relative attraction of precious metals as portfolio hedges.
4. Accelerating central bank demand
Central bank net purchases of gold remained strong in early 2026, consistent with a multi-year trend of official sector accumulation. Buying at already-elevated prices signals a strategic shift in reserve preferences rather than short-term speculation. When sovereign institutions increase gold holdings, it adds a durable layer of demand beneath market prices.
Why Is Silver the Overlooked Winner in This Forecast?
The World Bank reports a single precious metals index, but gold and silver behave differently. Gold tends to attract safe-haven flows, while silver combines safe-haven demand with strong industrial consumption. In 2026 silver may outpace gold on a percentage basis because it starts from a lower price base and faces persistent supply constraints.
Most silver supply is a by-product of base-metal mining, so production doesn’t expand quickly in response to higher silver prices. At the same time, demand from solar panels, electric vehicles, and data centers is rising, supporting an ongoing physical deficit. Historically, silver often lags gold early in a rally and then accelerates once momentum builds; current market signals suggest that silver’s catch-up phase could be underway.
Does the Historical Record Support the World Bank’s Forecast?
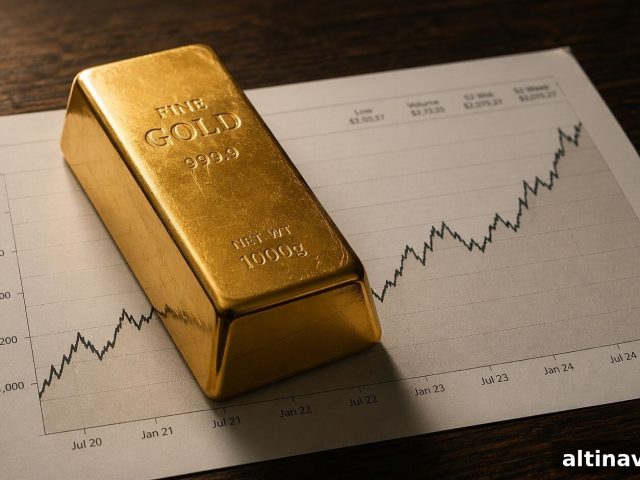
Recent price action supports the thesis of structural demand. Between May 2025 and May 2026, gold rose substantially year over year, even after a correction from an early-year peak. Physical demand for bars and coins remained robust through the pullback, indicating that buyers see these levels as buying opportunities rather than speculative froth. Past crises — such as 2008 and the COVID-19 shock — show similar patterns: initial volatility followed by renewed appetite for gold as trust in institutions and currencies weakens.
Is Now a Good Time to Add Precious Metals to Your Portfolio?
Long-term drivers that have supported precious metals — monetary expansion, geopolitical fragmentation, official reserve diversification, and structural deficits in certain markets — remain in place. Corrections from record highs are normal in extended bull markets and can present disciplined entry opportunities. For most investors, dollar-cost averaging into physical metal or allocated exposure can reduce the risk of trying to time short-term swings and build a position steadily through volatility.
A key caveat: a rapid resolution of the Middle East conflict could remove some safe-haven premium and temper short-term upside. However, persistent inflationary pressures, official sector buying, and industrial deficits—especially for silver—would still support higher prices over a longer horizon.
Stay On Top of Gold & Silver Prices
Receive concise market alerts delivered to your inbox.
People Also Ask
What is the World Bank’s precious metals forecast for 2026?
The World Bank’s April 2026 outlook projects a roughly 42% rise in its precious metals price index versus 2025 averages, making precious metals the top-performing commodity group in the forecast year. Energy and base metals are also expected to rise, but by smaller percentages.
Why is the World Bank forecasting such a large increase in precious metals prices?
The forecast reflects a convergence of factors: a major energy supply shock linked to conflict in the Middle East, rising global inflation, heightened stagflation risk, and growing demand from central banks and investors seeking safe assets.
Which precious metal is expected to perform best in 2026?
Silver is likely to show the largest percentage gains because it combines safe-haven appeal with strong industrial demand and an ongoing supply deficit. Gold should also rise materially but from a higher base, which tends to limit percentage gains.
What was the price of gold in May 2026?
In mid-May 2026, gold traded below its January peak but remained substantially above prior-year levels. Year-on-year gains were still strong, reflecting the durability of the underlying bull market despite short-term corrections.
What is stagflation and why does it support gold?
Stagflation combines slowing growth with rising prices. It erodes corporate earnings and real bond returns, making conventional assets less attractive. Gold benefits because it has no counterparty risk, no cash flows tied to corporate profitability, and a long record as a store of value when fiat purchasing power weakens.
So What Do You Actually Do With This Information?
A 42% projection for precious metals from a major institutional forecaster is notable and worth evaluating against your portfolio objectives. This outlook is driven by structural factors rather than a single headline event, so consider whether your allocations reflect the potential for increased market volatility and the defensive characteristics of metals.
If you’re considering adding exposure, dollar-cost averaging into physical metal or allocated holdings can smooth entry risk. Always align any changes with your timeframe, liquidity needs, and risk tolerance, and consult a qualified financial adviser for personalized advice.
SOURCES
1. World Bank Group — Commodity Markets Outlook April 2026 (press release and report).
2. World Bank Group — Commodity Markets Outlook in Eight Charts (summary).
3. World Gold Council — Gold Demand Trends Q1 2026 (central bank and physical demand data).
4. World Gold Council — Gold Demand Trends Q1 2026 overview.
5. Industry commentary and price outlooks from market analysts and major financial publications (May 2026).
6. Bureau of Economic Analysis — GDP advance estimate, Q1 2026.
7. U.S. Bureau of Labor Statistics — Consumer Price Index data.
8. Silver Institute — World Silver Survey 2026 (supply and demand analysis).
Disclaimer: This article is for informational and educational purposes only. It does not constitute investment advice. Consult a qualified financial adviser before making any investment decisions.
You may also like:
- Silver Price Outlook May 2026: Stop Chasing the Number
- Dollar Dominance Is Fading. Gold and Silver Are Paying Attention.
- GoldSilver: Home Storage and Vault in One Account
- The Bond King’s Golden Signal: Jeffrey Gundlach on Gold
- Gold Price Outlook May 2026: Why Institutional Forecasters Still See $5,000
- India’s ‘Patriotic’ Gold Buying Freeze: What It Means for Prices
- How to Time Your Gold & Silver Buys Using Technical Analysis
- Silver Jewelry or Bullion? A Buyer’s Guide to the Real Difference
Popular Topics
Picked from the archive
-
01
 Topics
Why Ray Dalio Recommends 5-15% of Your Portfolio in Gold
-
02
Topics
Gold and Silver Price Drop: Correction or Reversal?
-
03
Topics
US Q2 GDP Rises as Falling Imports Mask Weak Domestic Demand
-
04
Topics
Gold Drops as China Buys Most in 17 Months
-
05
Topics
Iran Blinked: Powell’s One Word Will Decide the Next Move
-
06
Topics
Gold Prices Rise for Seventh Week as Jobs Data Goes Dark
-
07
Topics
Is Gold Overpriced or Undervalued? What 3 Models Reveal
-
08
Topics
Gold Prices Jump as Fed Rate-Cut Odds Climb to 74 Percent