HSBC Cuts Gold Forecast by $304, Now Sees $4,750 by Year-End
HSBC (The Hongkong and Shanghai Banking Corporation) cut its 2026 average gold-price forecast by $304 on July 9, 2026, while leaving its year-end target unchanged. That seeming contradiction — a lower average forecast alongside a stable year-end target — explains more about HSBC’s outlook for gold in 2026 than the headline reduction alone.
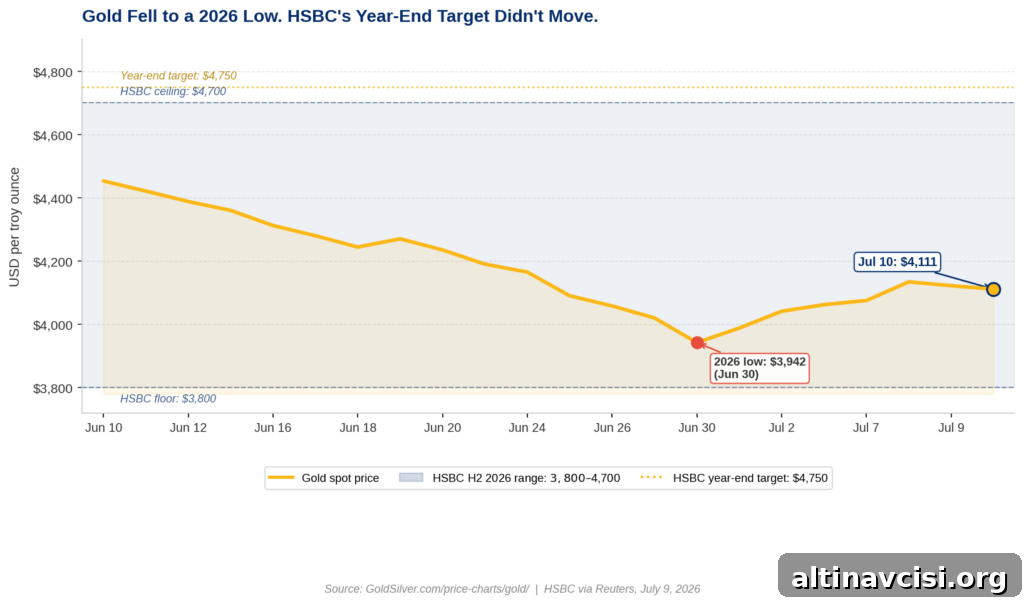
As of July 10, 2026, spot gold was trading near $4,103 per ounce, roughly 27% below the January 28 record high of $5,589.38. The bank’s revision highlights a near-term weakening in prices but preserves an expectation of recovery by the end of the year.
What Did HSBC Change About Its Gold Forecast?
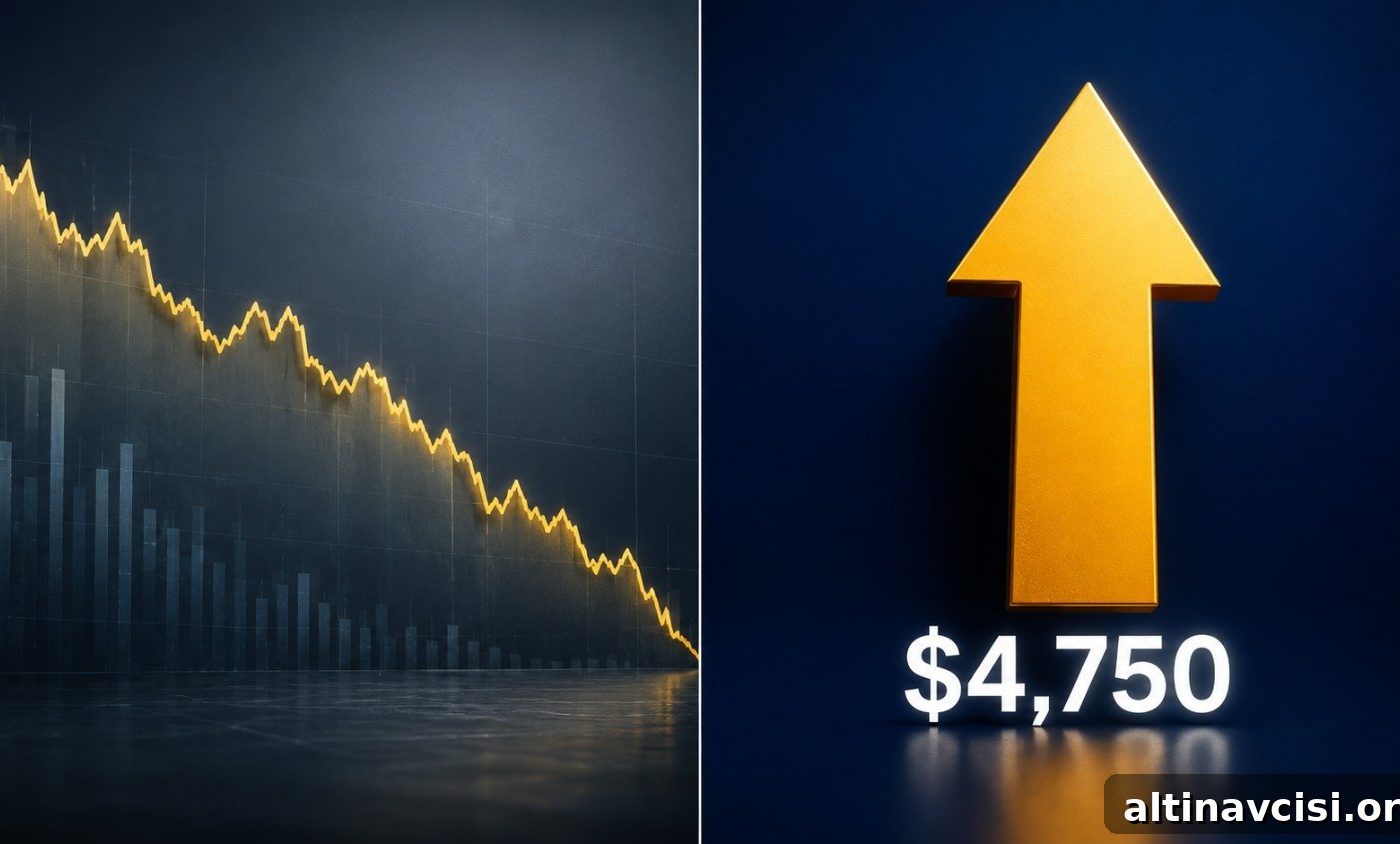
James Steel, HSBC’s Chief Precious Metals Analyst, lowered the bank’s 2026 average gold forecast to $4,560 per ounce from $4,864 and trimmed the 2027 average to $4,925 from $5,000. Despite those adjustments, HSBC kept its 2026 year-end target at $4,750 and its 2027 year-end target at $5,025. Longer-term projections for 2028 and 2029 were left at $5,200 and $5,300 respectively.
HSBC now expects gold to trade within a $3,800–$4,700 range for the remainder of 2026 and to close the year close to $4,750. The bank attributed the nearer-term downgrade primarily to shifting expectations for U.S. monetary policy and a firmer dollar. A hawkish Federal Reserve outlook raises the opportunity cost of holding a non-yielding asset like gold, while a stronger dollar tends to make gold more expensive for buyers using other currencies, reducing demand at the margin.
Why Does the Average-vs-Year-End Gap Matter?
Most headlines emphasized the cut to HSBC’s average forecast. But the more revealing point is what HSBC left unchanged: the year-end target. Lowering the average reflects an expectation that gold will spend more time trading at subdued levels across the second half of the year. Holding the year-end target steady signals that HSBC still expects a recovery by December. In short, the bank sees a softer path in the near term but expects the same destination.
HSBC did not revise its central bank demand forecast, which remained at 680 tonnes for 2026 and 850 tonnes for 2027. The bank also noted that the heavy gold ETF liquidation seen in the first half of 2026 could partially reverse in the second half as structural supports reassert themselves. Those supports include rising global fiscal deficits and continued pressure in sovereign debt markets. HSBC’s commentary also suggested that geopolitically driven declines tied to the Iran-related conflict are unlikely to be permanent headwinds, implying limited downside relative to the headline cut.
What Does This Mean for Gold’s Structural Case?
HSBC’s revision reads like a timing adjustment rather than a change to its long-term thesis. The structural factors that propelled gold from roughly $2,600 in late 2024 to the January 2026 peak — sustained fiscal deficits, central bank diversification away from U.S. Treasuries, and broader de-dollarization trends — remain central to HSBC’s long-horizon outlook. Those longer-term forecasts for 2028 and 2029 were left intact, reinforcing that the bank sees enduring drivers behind gold’s appeal.
Other major institutions have taken similar approaches in recent weeks: trimming near-term estimates while preserving their long-term convictions. When several large institutions simultaneously lower average forecasts but maintain year-end or long-term targets, it typically indicates a more difficult path to those targets rather than a reversal of the underlying thesis.
Today’s elevated real yields are a headwind for gold, yet the long-term U.S. fiscal trajectory requires continued, large-scale Treasury issuance. That dynamic limits how long truly restrictive rate conditions can persist before they become self-defeating for growth and debt sustainability. Gold’s role as an asset outside the traditional yield-bearing system remains a key element of its structural case.
Two Dates That Will Decide Which End of HSBC’s Range Gold Tests
Two near-term events will likely determine whether gold tests the upper or lower end of HSBC’s $3,800–$4,700 range. First is the U.S. consumer price index (CPI) report for June, due July 14. A cooler-than-expected CPI—more plausible after recent declines in oil prices—would reduce market odds of a Fed rate rise in September. Lower rate-hike probabilities compress gold’s opportunity cost and could support a price recovery toward HSBC’s year-end target.
The second key event is the Federal Open Market Committee (FOMC) meeting on July 28–29. Guidance from that meeting and any fresh signals about the Fed’s policy path will be decisive for risk sentiment, real yields, and the dollar. Taken together, the CPI release and the FOMC meeting will largely shape whether gold moves toward the lower bound near $3,800 or pushes back up toward the top of the range and the unchanged year-end expectation of $4,750.
Implications for Investors
For investors, HSBC’s update is a reminder to distinguish between near-term volatility and longer-term structural trends. The near-term picture depends heavily on inflation prints, Fed guidance, and short-term flows such as ETF liquidation and repositioning. Over the medium and long term, fiscal dynamics, central bank behavior, and geopolitical developments will matter most for gold’s role in diversified portfolios.
Investors considering exposure to gold should weigh timing risks, liquidity, and their own investment horizon. For those focused on shorter-term returns, the path and catalysts matter deeply. For longer-term investors, the unchanged year-end and multi-year forecasts reinforce an expectation that structural supports could re-emerge once short-term pressure eases.
SOURCES
1. Reuters — HSBC lowers 2026-27 gold price forecasts on hawkish Fed tilt, July 9, 2026
2. World Gold Council — Gold Demand Trends Q1 2026, April 29, 2026
3. CME Group — FedWatch Tool, September 2026 rate probabilities, accessed July 10, 2026
4. GoldSilver.com — Live Gold Price Charts, July 10, 2026
Disclaimer: This article is for informational purposes only and does not constitute financial or investment advice. Always consult a qualified financial adviser before making investment decisions.
You May Also Like:
- The Fed Named AI Its Top Inflation Risk. Gold Noticed.
- Five Days From Now, Two Numbers Will Decide Gold’s Second Half
- Bank of America Cut Its Gold Forecast. The Reason Is More Bullish Than It Looks.
- The Fed Is Split 9 to 8. Gold and Silver Are Paying the Price — Until July 14.
- Gold Is Sitting on $4,000. The World Gold Council Has a Model for What Happens Next.
- Trump Called the Deal Dead. Oil Jumped 6%. Gold Fell. Here Is Why Both Moves Make Perfect Sense.
Popular Topics
Picked from the archive
-
01
 Topics
Why Silver Price Jumped Nearly 5% Today
-
02
Topics
Why Global Silver Demand Exceeds Mining Supply
-
03
Topics
How Profit Booking Works in Gold and Silver
-
04
Topics
Why Gold Soared 40% This Year After Moody’s Downgrade
-
05
Topics
Silver-to-Dow Ratio: Is Silver Moving from Paper to Physical?
-
06
Topics
Fed Decision Looms: Gold Poised for 8:30 AM Reaction
-
07
Topics
Gold Drops 9%: CPI Report Could Extend or Reverse the Slide
-
08
Topics
Gold Drops 1.2%, Silver 2.8% as Support Holds