Why Gold Soared 40% This Year After Moody’s Downgrade
Key Takeaways
- On May 16, 2025, Moody’s downgraded the United States from Aaa to Aa1, making it the last major agency to remove the US from the top sovereign credit tier — a process S&P began in 2011 and Fitch continued in 2023.
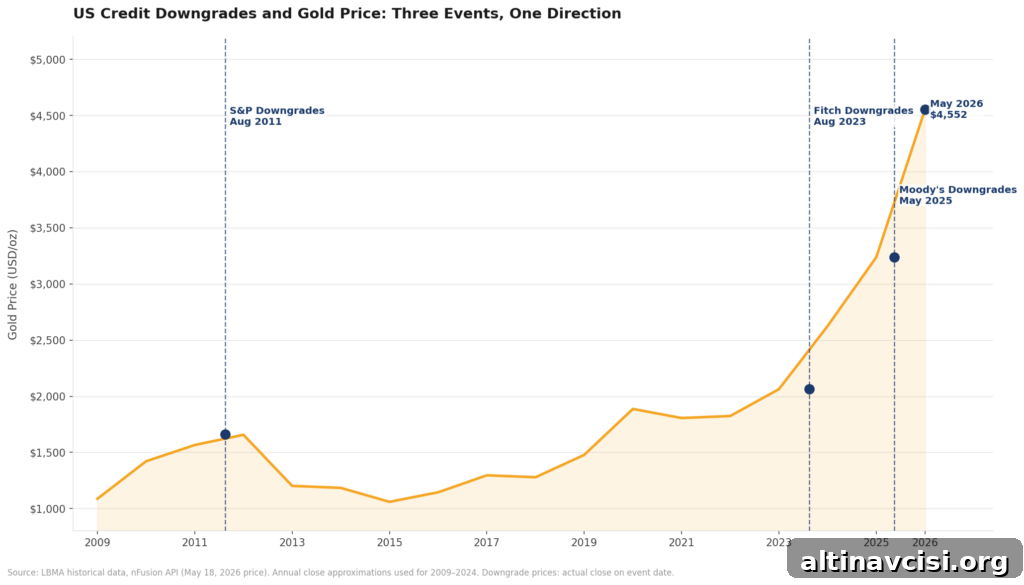
- On the downgrade day gold closed at $3,237 per ounce (LBMA spot). Over the following year it traded above $4,550 — a rise of more than 40% in twelve months, by LBMA spot pricing.
- Physical gold carries no counterparty risk: it has no issuer, no maturity, and cannot be downgraded by a ratings agency. That is a key reason central banks have been net buyers for many months.
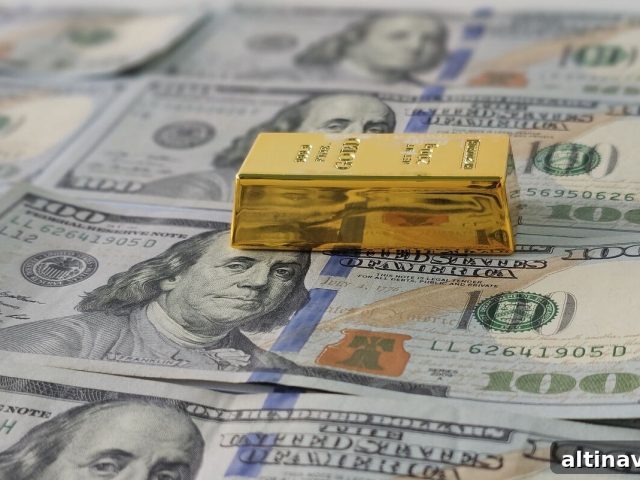
About a year ago a single event shifted market perception: the last major credit agency withdrew the United States from its highest rating category. That action removed the long-standing assumption that US Treasuries are the unquestioned global “risk-free” asset.
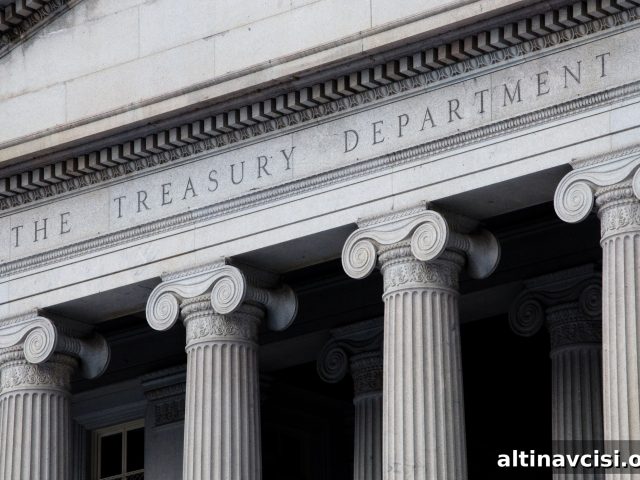
On May 16, 2025, Moody’s lowered the US sovereign rating from Aaa to Aa1. Together with S&P’s move in 2011 and Fitch’s action in 2023, this left no major agency assigning top-tier status to US government debt. On that same day gold closed at $3,237 per ounce, according to LBMA spot data.
Since then, gold has traded much higher, reflecting a broader re-evaluation of what “safe” means in global capital markets.
Why Did Moody’s Downgrade the US?
The downgrade was driven by two practical realities: the absolute size of federal debt and the growing cost of servicing it. US federal debt now exceeds $36.8 trillion (US Treasury data). Net interest payments topped $1 trillion in fiscal year 2026, according to the Congressional Budget Office — surpassing the US defense budget for the first time.
Analysts long expected a downgrade; the surprise was how long the top rating lasted. S&P removed the Aaa rating in August 2011, when debt was about $14 trillion. Fitch followed in August 2023. Moody’s delayed its decision, citing factors such as the dollar’s reserve status and Treasury market liquidity. Ultimately, rising interest costs and an interest burden that grew faster than the economy overwhelmed those considerations. When interest expense becomes a structural fiscal constraint, top-tier ratings are difficult to justify.

The Edge Every Investor Needs
Smarter precious metals investing starts here. The Nuggets Newsletter delivers market insights, central bank updates, global trends, educational videos, and practical analysis.
What Does a US Credit Downgrade Mean for Gold Prices?
Most coverage framed the downgrade as an issue of reputation. The more consequential effect is how it redefines “safe” across global portfolios. For decades, US Treasuries served as the baseline risk-free asset: they anchored insurance reserves, pension allocations, and the discount rates used across markets. Losing unanimous top-tier ratings forces institutions to revisit assumptions and compliance rules tied to “AAA” sovereign debt.
When that anchor shifts, capital must find alternatives. Gold offers a unique proposition: it has no issuer, no counterparty, and no credit rating to lose. A Treasury is a liability backed by a government. Gold is an asset that stands on its own. This fundamental difference explains why central banks and long-term institutional investors treat gold as a strategic hedge when sovereign creditworthiness is in question.
The shift is not purely symbolic. Portfolio rules that mandate AAA-rated sovereign exposure must be reconsidered; some investors will keep Treasuries for liquidity and market depth, while reallocating a portion of reserves to assets without sovereign backing. Gold is the primary asset class that meets that need.
What Has Gold Done in the 12 Months Since the Downgrade?
Markets have repriced over months rather than exploding in a single panic move. The 2011 S&P downgrade produced a sharp, short-lived spike: gold rose from about $1,660 to $1,917 in roughly four weeks. The response to Moody’s downgrade in 2025 was more prolonged.
Gold closed at $3,237 on May 16, 2025. Instead of a single dramatic surge, it climbed steadily, reaching an interim peak near $5,589 by January 2026 (USAGOLD reporting) before pulling back as monetary policy expectations firmed. Today it trades around $4,550 — roughly 40% higher than the close on the downgrade date per LBMA spot pricing. That pattern aligns with a structural re-pricing: institutions and central banks adjusting mandates and allocations over time.
Is the Structural Case for Gold Still Intact?
Yes. Credit ratings do not create market flows; they typically validate what large buyers are already doing. Central banks have been net buyers of gold for more than a year, according to World Gold Council data. Their purchases reflect independent assessments of geopolitical risk, currency diversification needs, and the desire to hold an asset without sovereign credit exposure.
While most capital will continue to use Treasuries for liquidity and regulatory reasons, a meaningful tranche of reserve assets can shift toward metal ownership when sovereign credit becomes less reliable. For institutions seeking an asset with no issuer, no maturity, and no rating to lose, gold remains the obvious choice.
How Should Individual Investors React to This Downgrade?
Avoid panic; favor perspective and a plan. The correct investment thesis has never been “the dollar collapses tomorrow.” Rather, the long-term fiscal trajectory made certain risks more likely. The downgrade simply made that reality explicit. Investors should assess exposure to sovereign credit risk, liquidity needs, and time horizon.
For those seeking diversification from sovereign liabilities, gold can serve as a non-correlated asset with no counterparty risk. The recent pullback from interim highs has left prices at levels that many view as reflecting structural demand rather than purely momentum-driven gains. Central bank buying — deliberate and sustained — indicates institutional acceptance of gold’s role as a strategic reserve asset.
In short: Moody’s 2025 decision confirmed a long-running fiscal trend. Markets adjusted, and gold appreciated by more than 40% in the year that followed. Investors should use that confirmation to revisit portfolio construction, align allocations with risk tolerance, and consider assets that provide true diversification from sovereign credit risk.
Stay On Top of Gold & Silver Prices
Get important market alerts sent straight to your inbox.
SOURCES
1. Moody’s Ratings — US Sovereign Downgrade Announcement
2. US Treasury Fiscal Data — Debt to the Penny
3. Congressional Budget Office — Budget and Economic Outlook: 2026 to 2036
4. LBMA — Gold Price Data
5. World Gold Council — Gold Demand Trends: Full Year 2025
6. GoldPrice.org — Gold Price on May 16, 2025
7. USAGOLD — Daily Gold Price History, January 2026 All-Time High
You May Also Like:
- No Deal, No Premium: Why Silver Fell 7% at the Trump-Xi Summit
- Gold Fell. China Bought Its Most in 17 Months. Here’s Why.
- Why Silver Falls Harder Than Gold — And What It Means
- Gold Near $4,700: The Chaos Isn’t a Ceiling. It’s a Floor
- 5 Forces Shaping Gold and Silver at the Beijing Summit
- The Real Reason Gold Falls When Inflation Surges
- CPI Hits 3.8%. Gold Falls. The Mechanism Nobody Explains
- Why the Gold Silver Ratio Is Falling — and What It Means
Popular Topics
Picked from the archive
-
01
 Topics
Dollar Drops as Markets Price In Fed Cuts; Tariff Fears Rise
-
02
Topics
COMEX Silver Coverage Ratio: Is Your Paper Silver Genuine?
-
03
Topics
Gold Price Forecast: Oil Futures Diverge From Stocks
-
04
Topics
Depression-Era Tariffs Keep 10-Year Treasury Yields High
-
05
Topics
Silver Prices Could Rise 15-20% as Analysts Warn of Deficits
-
06
Topics
Why Turkey Sold Its Gold and What It Means for Sound Money
-
07
Topics
US Tariffs on Swiss Gold Bars Disrupt Global Supply
-
08
Topics
How the SILVER Act Affects Precious Metals Investors