Gold Drops 1.2%, Silver 2.8% as Support Holds
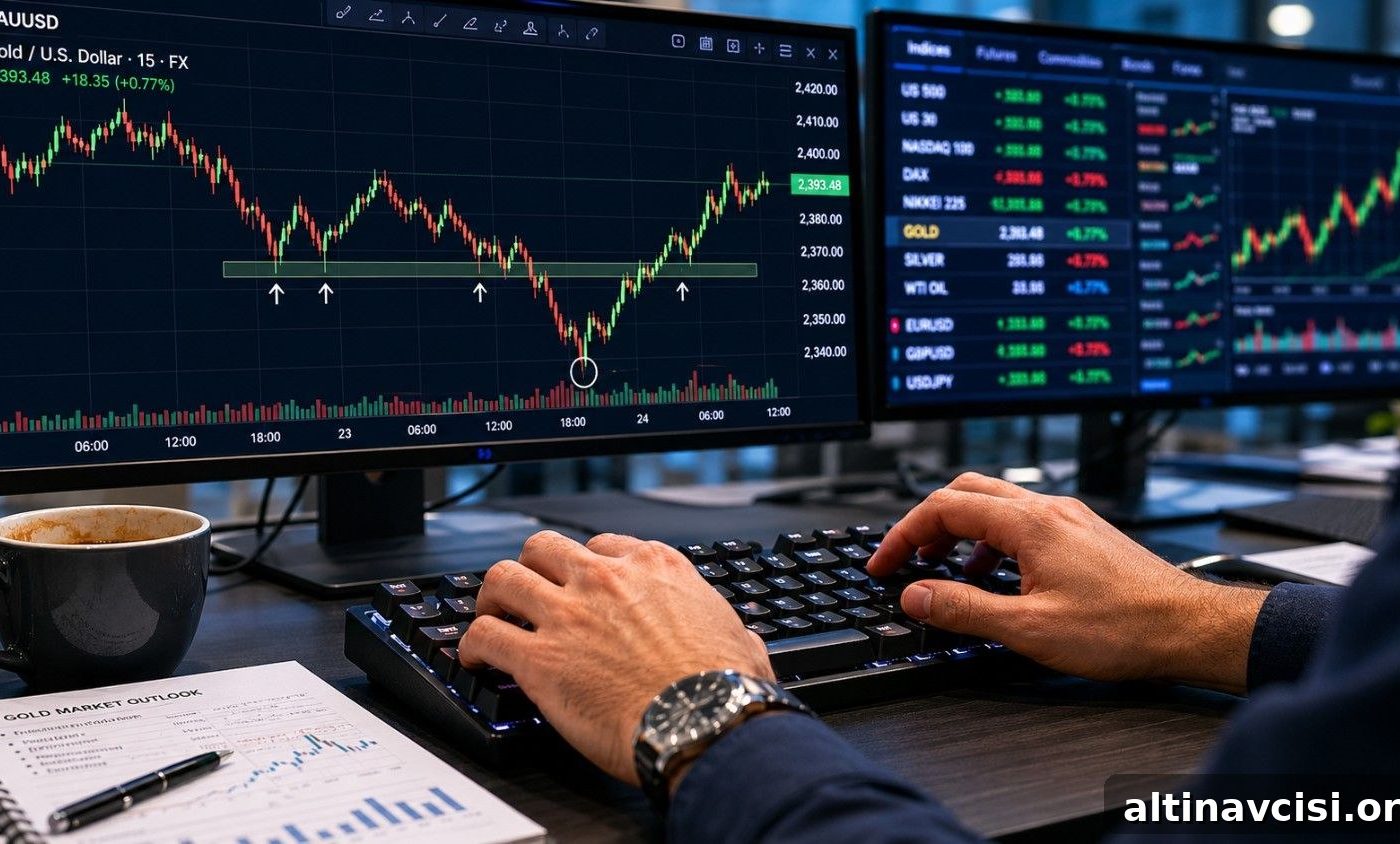
In today’s update: Gold’s downside support has held even after a holiday selloff — prices briefly touched $4,455 for gold and $74.90 for silver on light volume. Central banks bought 244 tonnes of gold in Q1, and the $4,440 support zone has held multiple times in recent sessions. Here’s what the data actually shows.
Gold’s price floor is the key takeaway today. Markets reopened after the Memorial Day holiday and saw an abrupt selloff: gold fell more than $50 from the open and silver declined nearly $2, continuing losses into a second session. Headlines can look dramatic, but the underlying data tells a different, more measured story. Below are the five factors that matter right now for precious metals investors.
Why Is Silver Falling Faster Than Gold Today?
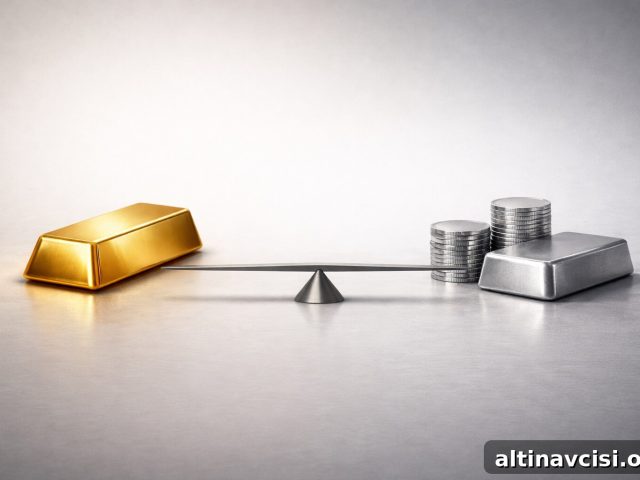
Silver declined about 2.79% while gold dropped roughly 1.18%, producing a widening gold/silver ratio — a classic ratio expansion event. This often happens during broad, liquidity-driven selloffs when traders first reprice silver’s industrial premium before testing gold’s monetary floor. Put simply, silver’s larger short-term move doesn’t necessarily signal a change in the long-term trend.
Importantly, the physical demand picture remains intact. The World Gold Council’s Q1 2026 report shows bar and coin demand rose 42% year-over-year to 474 tonnes — one of the largest quarterly totals on record. Significant physical buying like that does not vanish in a single session. Historically, when silver underperforms in a bull market, the cause is usually temporary selling pressure and liquidity dynamics, not a reversal of the structural supply deficit that has been drawing down global silver inventories over several years.

The Edge Every Investor Needs
Smarter precious metals investing starts here. The Nuggets Newsletter delivers timely market insight, Fed coverage, global trends, and short educational videos to help investors stay informed.
What Is the Gold Price Floor Right Now — and Is It Holding?
Gold tested the $4,440 area intraday before buying resumed. This was the third time in five sessions that bids appeared at this level, which suggests a structural support zone rather than a one-off technical bounce. When institutional, price-sensitive buyers repeatedly step in at the same price, market participants view that level as a defended floor backed by “real money.”
The Q1 demand data helps explain the defense. Central banks added a net 244 tonnes of gold in the first quarter, a rise from the prior year and above the recent five-year average. China’s central bank also increased its official holdings during the quarter. On a value basis, total gold demand reached a record figure for the quarter. When the world’s largest official and institutional buyers are accumulating at these levels, a short-term holiday selloff does not negate the broader structural picture.
What Causes Gold Prices to Drop After a Holiday Weekend?
Holiday-shortened weeks often produce exaggerated intraday moves because market depth is thinner. With US desks closed for Memorial Day, Tuesday’s session opened into light order books, amplifying price swings in both directions. These low-volume conditions commonly create outsized moves that tend to fade as normal liquidity returns later in the week.
Even after the drop, the structural drivers remain unchanged: central bank buying in Q1, a Fed that has not cut rates so far in 2026, and a shift in futures pricing that has traders assigning roughly a 51% chance to a December rate hike. Geopolitical tensions also persist. Those fundamentals are not erased by a short holiday effect, so intraday volatility should be interpreted in light of the broader data set rather than as a fundamental reversal.
Why Didn’t Gold Rise on the Iran Strikes?
Over the weekend, US strikes against Iranian targets were reported. In prior cycles, such headlines often sparked sharp gold rallies. The muted reaction this time is meaningful: it suggests geopolitical risk is already priced into the market’s base level for gold.
Rather than producing a sudden premium, geopolitical risk appears to be embedded in the structural floor. When gold no longer spikes on escalation headlines, the market is signaling that the war premium is part of core demand. From here, further upside for gold is more likely to come from second-order effects — namely, sustained energy disruptions that push inflation higher than central banks can easily control.
Supporting that view, headline US CPI rose to 3.8% in April, driven substantially by energy costs. Those inflation dynamics are a more powerful and persistent influence on gold’s structural case than any single military event.
What Does Tomorrow’s GDP Report Mean for Gold and Silver Prices?
The Bureau of Economic Analysis will publish a second estimate of Q1 2026 GDP. The advance reading showed annualized growth of 2.0%, up from 0.5% in Q4, while the PCE price index rose to 4.5% — a level that points to significant inflationary pressure. That mix of moderate growth and elevated inflation is broadly consistent with stagflationary conditions and is highly relevant for precious metals.
If the revised GDP figure weakens growth or shows higher inflation, market expectations for further rate hikes would likely increase and the dollar could strengthen, creating near-term pressure on gold. Conversely, if growth holds while inflation remains high, the Federal Reserve would face a policy bind: cuts could rekindle inflation, while hikes could undermine growth. Historically, this kind of policy stalemate has favored gold and silver as stores of value. For long-term investors, the structural implication is that precious metals often perform well during periods when central banks cannot both tame inflation and support growth simultaneously.
Stay On Top of Gold & Silver Prices
Get important market alerts sent straight to your inbox.
SOURCES
1. nFusion Solutions — Spot Price API
2. World Gold Council — Gold Demand Trends Q1 2026
3. World Gold Council — Central Banks Q1 2026
4. Bureau of Labor Statistics — Consumer Price Index Summary, April 2026
5. Bureau of Economic Analysis — GDP Advance Estimate, Q1 2026
6. CME Group — FedWatch Tool, 30-Day Federal Funds Futures
7. NPR — Iran and U.S. coverage, May 25, 2026
Disclaimer: This article is for informational purposes only and does not constitute financial or investment advice. Consult a qualified financial adviser before making investment decisions.
You May Also Like:
- UBS Just Cut Its Gold Target by $400. The Part They Kept Is the Real Story.
- Why Gold Is Falling Today — And Why $4,500 Is Holding.
- Gold Is Down Today. Here’s Why Smart Money Is Still Buying.
- Silver Up 3%. Gold Up 1.3%. The Ratio Tells You Everything.
- Iran News Sent Gold Price Both Ways. The Driver Was Never Iran.
- Gold Falls 0.5% on Iran Deal: The Floor Holds
- Is Gold Being Repriced? Five Major Institutions Say Yes.
- Silver Dropped 12%. Gold Dropped 3%. That Gap Is the Story.
Popular Topics
Picked from the archive
-
01
 Topics
Stronger Economy Delays Rate Cuts, Pressures Bond Market
-
02
Topics
Gold Price Rebounds Amid Iran Tensions, Fed Moves, Dollar Surge
-
03
Topics
401(k) Rollover to a Gold IRA: Step-by-Step Guide
-
04
Topics
Silver Slides While Gold Holds as Markets Reduce Risk
-
05
Topics
Gold Price Tops $3,600 After $1,000 Rally This Year
-
06
Topics
Gold Prices Rise on Fed Policy, Debt Concerns and Asian Demand
-
07
Topics
Gold vs Silver: Liquidity Explained for Investors
-
08
Topics
Dollar’s Decline: What It Means for Gold and Silver