Buying at the Top: Survival Guide for Gold and Silver Investors
Key Takeaways
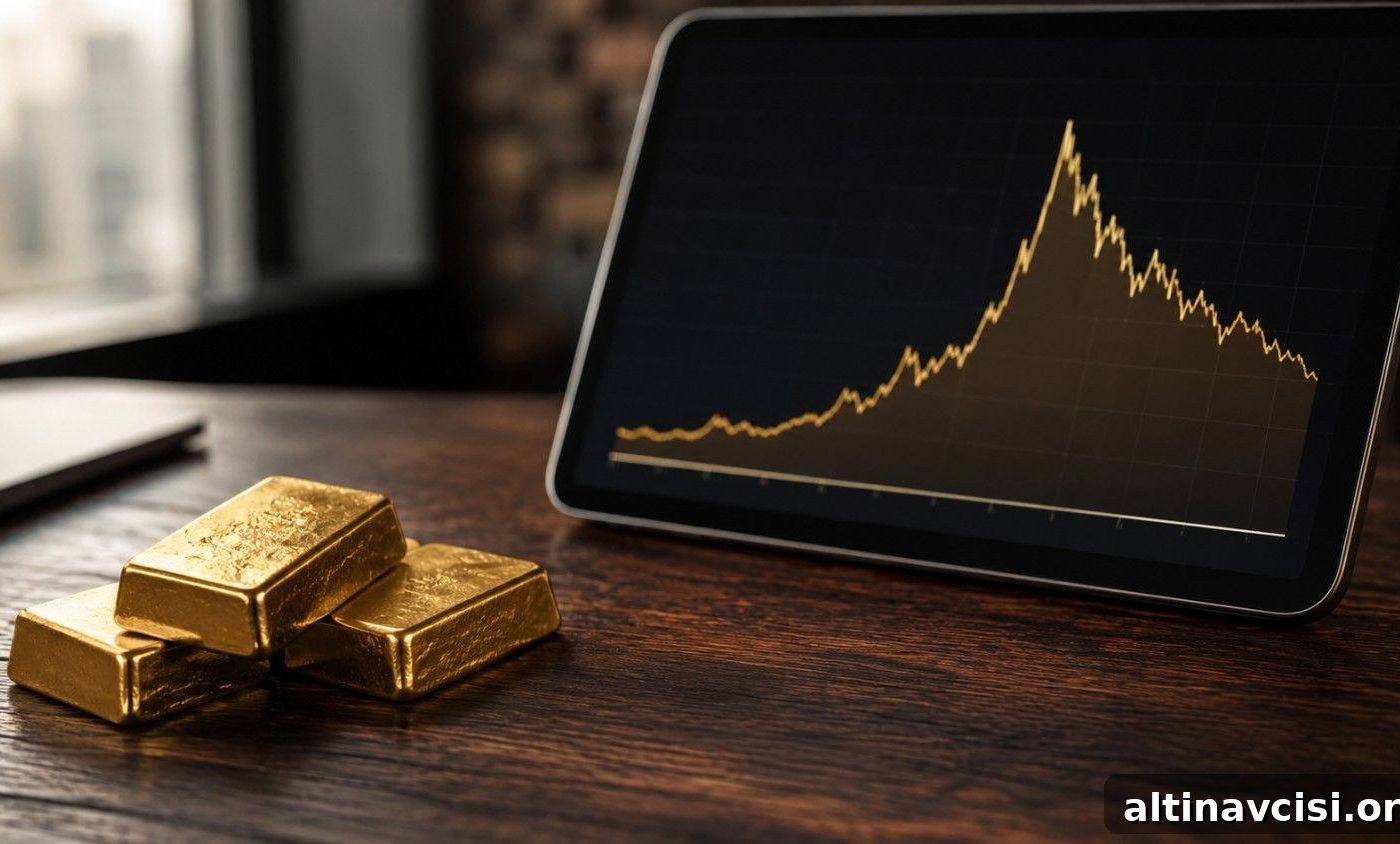
- Gold reached an all-time high of $5,589.38 per ounce in January 2026 and then corrected by roughly 26% over the following months — a drawdown consistent with mid-cycle corrections seen in prior bull markets.
- An unrealized loss is not final unless you sell; your decision now determines whether that loss becomes permanent.
- Three primary strategies are available: hold through the consolidation, dollar-cost average to lower your break-even, or sell to harvest a tax loss and immediately repurchase (physical metals are excluded from the wash-sale rule).
- The Gold-to-Silver Ratio is near 69:1, within its long-term average of about 60–70:1, so neither metal is dramatically overpriced or underpriced relative to the other.
- Historic gold bull markets have seen corrections of 15–47%; in each case the longer-term structural thesis supporting ownership ultimately proved intact.
Gold hit a record $5,589.38 per ounce in January 2026 and later dropped about 26% from that high. If you purchased near the peak, you are facing a paper loss, which can feel immediate and emotional — but it is not permanent unless you choose to sell.
This guide helps investors who bought gold or silver near a high and are now deciding how to respond. It explains how to assess your position, outlines three realistic strategic responses, discusses the Gold-to-Silver Ratio, and reviews whether the structural case for holding physical metal has changed. While this piece references the January 2026 spike and subsequent correction, the practical guidance applies across cycles.
Where Do You Actually Stand? A Simple Diagnostic
When prices fall sharply, the instinct is to check the quote constantly. That won’t help. Before deciding, gather three clear numbers:
Your true average cost basis. If you made multiple purchases, blend them. For example, buying $5,000 at $3,500 and another $5,000 at $5,589 results in a blended cost near $4,545 per ounce. Add up what you paid and divide by the total ounces to calculate your break-even.
Your concentration. Many advisors recommend holding 5–15% of a total portfolio in precious metals. If your allocation sits in that range, a 26% drawdown is painful but unlikely to threaten your overall plan. If you allocated 25–40% near a peak, you face different risks and should evaluate options more carefully.
Your liquidity position. Physical gold is intentionally illiquid compared with cash or many securities. If you will need the proceeds within 12–18 months, forced selling could lock in losses. Ask yourself: can I leave this position untouched for three years?
The Knowledge That Changes Everything

Two essential guides — free. Learn why gold matters and why fiat currencies reliably lose purchasing power over time.
Three Practical Strategies After Buying Gold Near a Peak
1) Hold and Wait
Holding is the simplest strategy but often the hardest emotionally. It’s a conscious decision to store your metal, stop refreshing quotes, and let the structural case play out. This is not passive neglect — it’s an active conviction that short-term volatility does not overturn long-term monetary trends.
Historically, meaningful gold bull markets included sharp mid-cycle corrections. The 1970s saw multiple pullbacks, including a 47% drop between 1974 and 1976, before gold rose dramatically into 1980. The 2001–2011 cycle featured recurring 15–20% corrections and a 34% decline during 2008; in each instance, those who sold in panic missed the rebound. The current ~26% correction is consistent with historical mid-cycle consolidation rather than structural failure.
When holding makes sense: your allocation remains within a prudent range, you have other liquid savings, and the reasons you bought gold (currency debasement, central bank reserve diversification, fiscal imbalance) still apply.
2) Dollar-Cost Averaging (Buy More to Lower Your Break-Even)
Buying additional metal at lower prices reduces your blended cost per ounce. For example, buying 1 ounce at $5,589 and another at $4,102 produces a blended cost around $4,845. An equal-dollar example also shows improved average cost per ounce. This approach removes the need to time the bottom and is effective when you expect higher prices over a multi-year horizon.
Trade-offs: you must commit more capital to a falling market and accept further short-term volatility on new purchases. Dollar-cost averaging suits investors with spare capital and conviction in the long-term thesis.
3) Tax-Loss Harvesting (Sell and Repurchase)
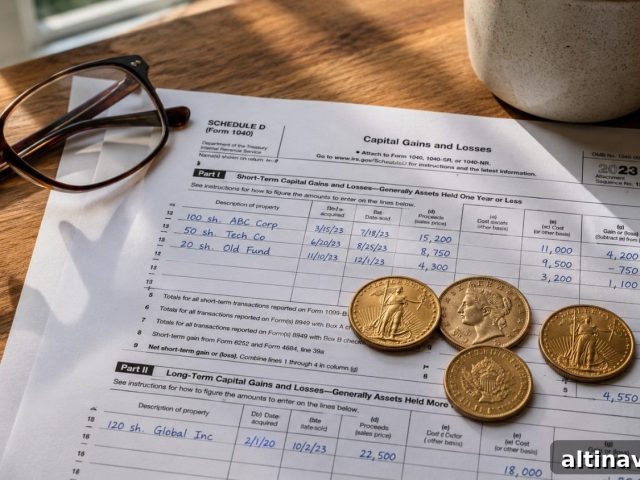
Tax-loss harvesting means selling a loss position to offset capital gains elsewhere and potentially rebuying the same metal immediately. The IRS treats physical gold and silver as collectibles (IRC Section 408(m)), but the wash-sale disallowance in IRC Section 1091 applies to stocks and securities, not to physical metals. That means selling physical gold at a loss and immediately repurchasing it typically preserves the tax loss.
A practical example: selling an ounce bought at $5,589 for $4,102 realizes a loss of approximately $1,487 per ounce. That loss can offset capital gains, reducing the current tax bill. However, dealer spreads, shipping, and storage fees reduce the net benefit. This strategy is most attractive to investors with substantial capital gains or higher marginal tax rates.
When tax-loss harvesting makes sense: you have significant gains elsewhere, are in a higher tax bracket, and can execute sale and repurchase efficiently despite transaction costs.
Is Silver a Better Bet Now? Understanding the Gold-to-Silver Ratio
The Gold-to-Silver Ratio measures how many ounces of silver equate to one ounce of gold. As of July 10, 2026, it was approximately 69:1, which falls within the modern average range of about 60–70:1. Extreme readings (e.g., 125:1 in March 2020) can signal pronounced relative value; 69:1 is not extreme.
Silver has supply-side and industrial demand tailwinds: the Silver Institute projected a supply deficit in 2026, and industrial uses (solar, EVs, electronics) account for a significant share of demand. But silver is typically more volatile than gold; it moves faster in both directions because the market is smaller and more thinly traded. If you are already strained by a gold decline, adding silver’s volatility may worsen your psychological stress.
Ratio-based rebalancing (shifting between gold and silver as the ratio moves) can work, but it requires patience measured in months or years, not days. At current ratios, reallocating toward silver can be justified but is not an urgent arbitrage opportunity.
Has the Fundamental Case for Gold Changed?
For long-term holders, the only question that matters is whether the structural reasons for owning gold have changed. Typical drivers include persistent fiscal deficits, central bank balance-sheet expansion, reserve diversification away from the dollar, and inflationary pressure that erodes fiat purchasing power.
As of mid‑2026, those structural drivers remain in place. Central banks continued net purchases early in the year, and institutions signaled ongoing reserve diversification. The January price spike included a cyclical safe-haven premium tied to geopolitical risk; when that premium partially unwound and equities recovered, gold gave back some reactive gains. Analysts describe the correction as cyclical rather than structural.
Major financial institutions vary in short-term targets, but many expect higher medium-term prices because the structural thesis persists. Short-term direction depends on uncertain factors — central bank policy, geopolitical developments, and equity market behavior — none of which negate the multi-year case for holding ounces of a finite physical asset.
The Long Game: Ounces Over Dollars
Gold is best viewed as a long-term store of value. Measure your holdings in ounces, not dollar value. Ounces cannot be printed or diluted; the fiat price fluctuates. Over decades, monetary debasement and relative scarcity are the mechanisms that drive gold’s real value higher.
Successful precious metals investors typically size positions conservatively, understand the underlying monetary case, and accept periodic drawdowns. They review allocations periodically, rebalance when necessary, and avoid emotionally driven sales during corrections.
Stay On Top of Gold & Silver Prices
Receive timely market alerts and analysis directly to your inbox.
People Also Ask
What should I do if I bought gold at the all-time high?
Begin with the diagnostic: calculate your averaged cost basis, check whether your allocation is within a prudent range (commonly 5–15%), and verify you have sufficient liquidity to avoid forced sales. From there, choose to hold, dollar-cost average, or harvest a tax loss and repurchase. The best option depends on your liquidity needs, tax position, and conviction in the long-term thesis.
How long does gold typically take to recover after a major correction?
Recovery periods vary. Corrections in past bull markets have resolved in 12–48 months depending on severity and whether structural drivers remained intact. The 2008 drop recovered in about three years; the deep mid-1970s correction resolved over roughly four years before the 1980 peak. Timelines assume the underlying bullish drivers persist.
Does dollar-cost averaging work for gold?
Yes, when you have spare capital and a multi-year horizon. It lowers your average cost without requiring market timing. It’s most effective if you expect prices to be higher over an 18–36 month horizon and can tolerate interim volatility.
Can I claim a tax loss on physical gold without triggering the wash-sale rule?
Generally yes: wash-sale rules apply to stocks and securities, not to physical precious metals. Selling physical gold at a loss and immediately repurchasing typically preserves the deductible loss, but transaction costs and dealer spreads reduce net benefit. Consult a qualified tax advisor for personalized guidance.
Is the Gold-to-Silver Ratio a good signal right now?
At about 69:1 (July 10, 2026), the ratio is within its long-term range and not signaling a dramatic mispricing. Ratios above ~80:1 historically favor adding silver; ratios below ~50:1 tend to favor gold becoming relatively cheap. At current levels, rebalancing toward silver can be justified but is not an urgent arbitrage trade.
SOURCES
World Gold Council (Gold Mid-Year Outlook 2026; Gold Demand Trends Q1 2026); LBMA historical benchmark records; IRS guidance on capital gains and collectibles (IRC Section 408(m)); J.P. Morgan Global Research; Silver Institute World Silver Survey 2026; European Central Bank publications (June 2026); ING commodities commentary; GoldSilver market analysis and price charts; LegalClarity and Kiplinger commentary on tax rules; Accounting Today; CBS News reporting on the gold all-time high; Goldman Sachs precious metals outlook; Federal Reserve historical data on gold bull markets.
Disclaimer: This article is informational only and is not financial or tax advice. Consult a qualified financial or tax professional before making investment decisions.
You May Also Like:
- How Do Gold Price Cycles Work? A Framework Across Four Time Horizons
- The $300 Billion Lesson: What Frozen Reserves Taught Central Banks About Gold
- How To Perform Silver Technical Analysis (in 5 Steps)
- Who Controls the Gold Market? Meet the Five Banks That Settle Every Ounce
- How the Jobs Report Moves Gold and Silver: The Five-Step Chain Behind Every Move
- What Is Profit Booking in Gold and Silver? The Mechanism Explained
- Gold Technical Analysis: A Complete Investor’s Guide
Popular Topics
Picked from the archive
-
01
 Topics
Selling Gold? How the 28% Collectibles Tax Rule Works
-
02
Topics
Gold Volatility Index (GVZ): What It Means for Investors
-
03
Topics
Silver Price Forecast 2026-2027: Bull vs Bear Outlook
-
04
Topics
Gold Hits $4,000: Wake-Up Call for Markets and Policymakers
-
05
Topics
Gold Safe-Haven Demand Returns After 9-Day Selloff
-
06
Topics
Gold, Silver Rally as Federal Reserve Independence Is Questioned
-
07
Topics
PCE Hits 3.8%, GDP 1.6%: What Drove Gold Higher
-
08
Topics
Why Gold Prices Are Holding at $5,000 Today