PCE Hits 3.8%, GDP 1.6%: What Drove Gold Higher
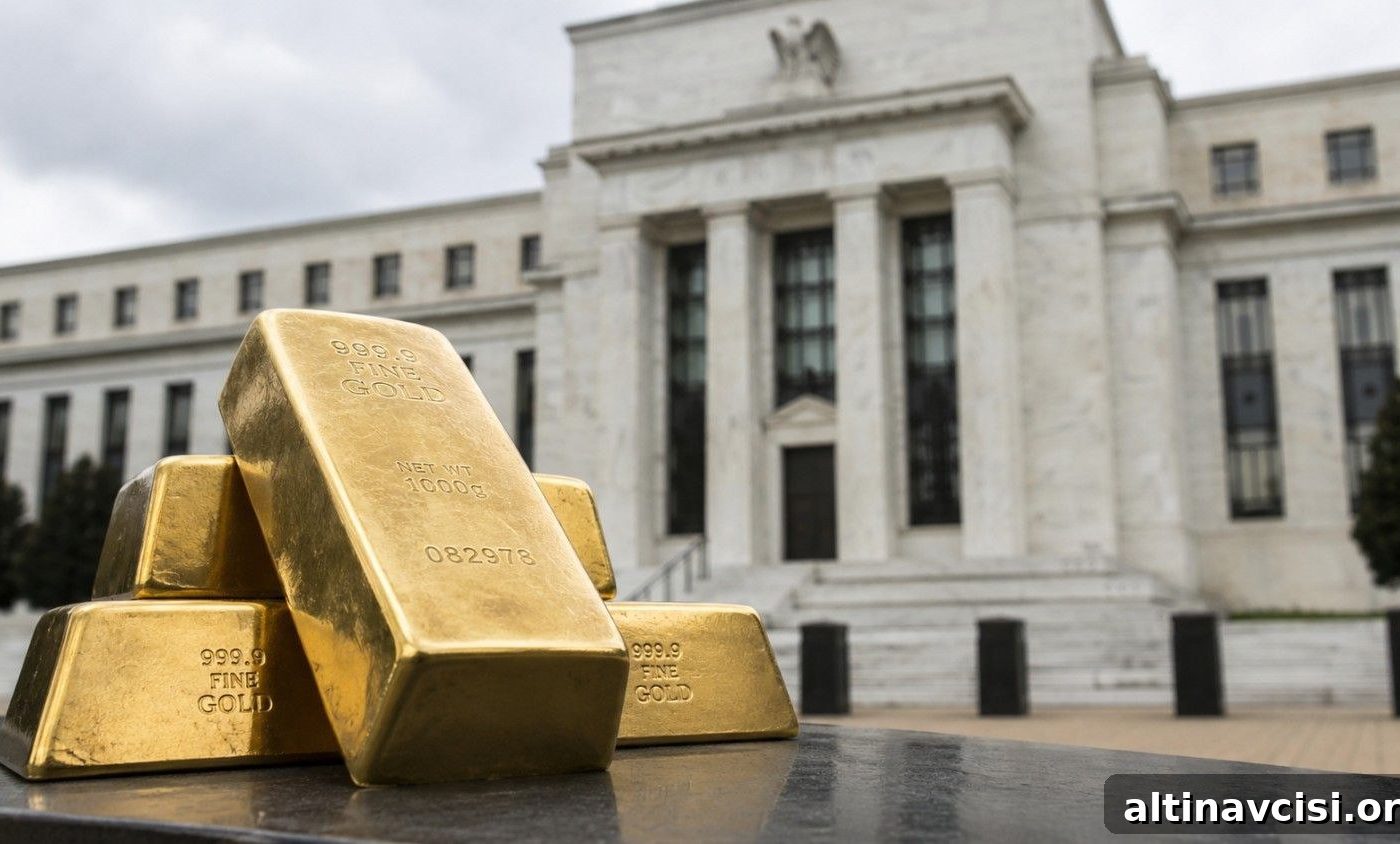
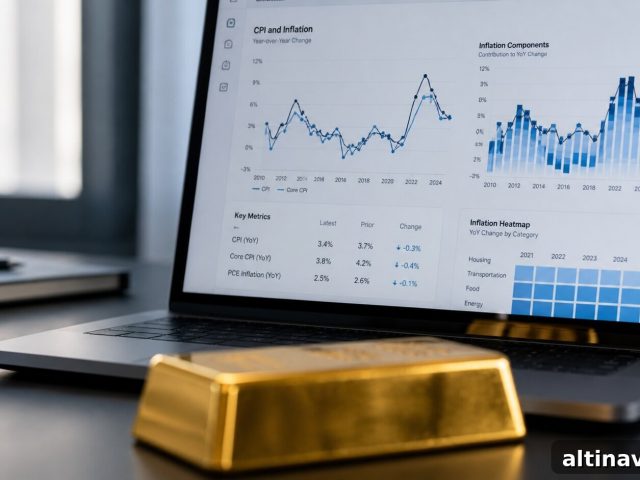
Yesterday the Bureau of Economic Analysis released two data points that belong in the same sentence: headline PCE inflation accelerated to a 3.8% annual rate in April — the strongest reading since May 2023 — while first-quarter GDP was revised lower to a 1.6% annualized pace, down from the initial 2.0% estimate. That combination — slowing growth alongside hotter inflation — evokes a classic economic concern: stagflation.
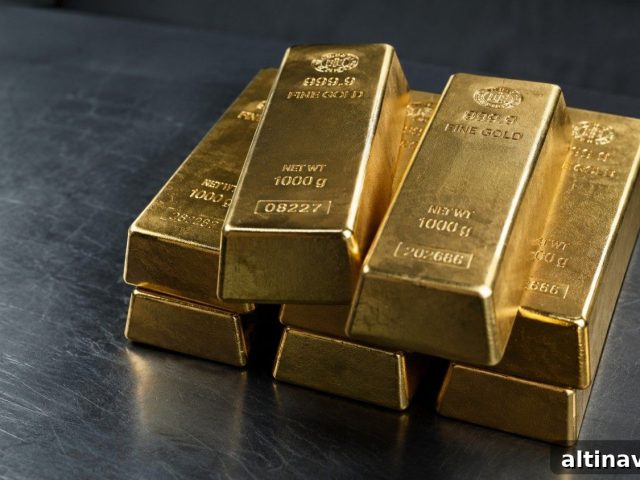
Gold finished the session up roughly 1.5%, trading near $4,563. At first glance, a precious metal rallying after the Fed’s preferred inflation gauge rose might seem counterintuitive. In reality it highlights gold’s role as a portfolio hedge: when real yields compress and inflation expectations rise, gold typically benefits.
Why Did Gold Rise After a Hot Inflation Report?
On the monthly side, core PCE decelerated to 0.2% for April versus market expectations near 0.3%. That softer monthly pace gave bond markets room to breathe and sent the 10-year Treasury yield lower, easing nominal rates and compressing real yields. Because gold is a non-yielding asset, lower real yields reduce the opportunity cost of holding gold and therefore act as a direct mechanical tailwind for gold prices.
Put simply: if a Treasury bond yields roughly 4.44% while inflation runs near 3.8%, the real return is only a fraction above zero — making the yield advantage of bonds over gold minimal. In that environment, investors often increase their allocations to gold to preserve purchasing power and hedge against continued price pressures.
Annual data painted a tougher picture for households. Core PCE moved higher year-over-year, energy costs have jumped substantially, and real disposable income declined in April for the third straight month. The personal savings rate fell to levels not seen since mid-2022. These trends show consumers are increasingly spending just to keep pace, not gaining purchasing power. That situation — weak growth with persistent inflation — is precisely the macro backdrop that historically supports demand for physical gold.
The Edge Every Investor Needs
Smarter precious metals investing starts here. The Nuggets Newsletter delivers concise market insights, Fed updates, global trends, and educational content to help you make informed decisions.
What Makes Stagflation the Hardest Problem a Fed Chair Can Face?
When growth stalls but inflation remains elevated, the Federal Reserve’s toolkit loses its clean options. Cutting rates helps growth but risks entrenching inflation; raising rates helps curb inflation but risks tipping slow growth into contraction. That trade-off is the defining challenge of stagflation.
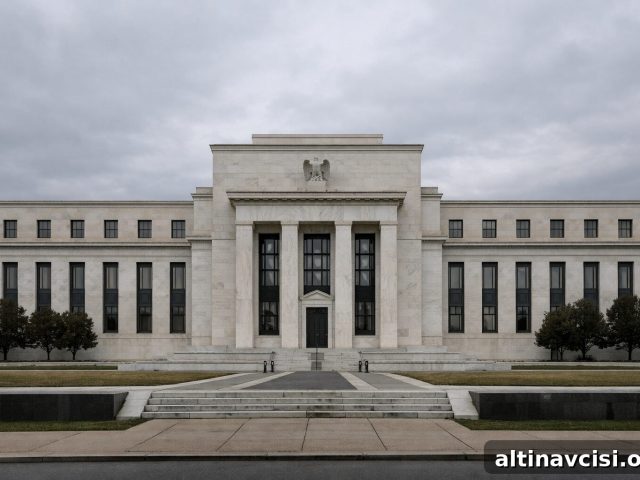
Kevin Warsh takes the helm as Fed chair with this dilemma squarely in front of him. His early policy decisions will be constrained by conflicting forces: persistently higher inflation readings and a growth outlook that has softened. The Fed’s statement language, decisions on quantitative tightening, and guidance about balance-sheet reduction will all be closely watched for how they influence real yields, market liquidity, and the dollar — all of which affect gold prices.
In practice, the Fed must juggle timely data releases, geopolitical developments that affect energy prices, and evolving market expectations. Those inputs will shape whether monetary policy tilts toward tighter conditions to tame inflation or toward support for growth, each path carrying distinct implications for asset markets and the outlook for gold.
How Has Gold Performed Historically During Stagflation?
Historical analysis covering multiple stagflation episodes finds gold has often outperformed other major asset classes. The practical reason is straightforward and mechanical: stagflation tends to compress real yields, reducing the opportunity cost of holding non-yielding assets like physical gold. When real yields fall toward zero or below, gold becomes relatively more attractive as a store of value.
The 1970s are the most cited example: during that decade gold delivered substantial nominal gains while equities and bonds struggled in real terms as inflation eroded returns. Across broader datasets, analysts have documented that gold’s performance during stagflationary regimes has been robust relative to alternatives, underscoring its role as a hedge against persistent inflation and monetary debasement.
Today, real yields are thin but still slightly positive. What matters for gold is direction: if inflation accelerates or if policy expectations shift toward more accommodative outcomes over the medium term, the effective real yield available on safe assets would decline further, strengthening the case for gold as part of a diversified portfolio.
What Should Gold Investors Watch at Warsh’s June 16–17 Press Conference?
Three clear signals will indicate whether the June meeting is likely to create short-term headwinds for gold or reinforce its structural case:
1. Removal of a dovish bias from the policy statement. If the Fed drops any language suggesting a future easing bias, it would be a hawkish signal that can push real yields higher and pressure gold.
2. Signals of faster quantitative tightening (QT). Accelerated QT tightens financial conditions independently of the policy rate. Clear guidance on faster balance-sheet runoff would reduce liquidity and can weigh on precious metals in the near term.
3. Commitment to an aggressive balance-sheet reduction. A credible, structural plan to shrink the Fed’s holdings more quickly tends to strengthen the dollar and raise real rates, which historically acts as a headwind for dollar-priced gold.
All three items are important near-term indicators, but they do not necessarily overturn the medium-term environment. U.S. fiscal deficits are expanding, energy costs have repriced, real incomes are under pressure and household savings are lower than earlier in the cycle. Those structural trends support the thesis for holding gold as a reserve asset outside the conventional financial system.
Gold remains below its all-time high from earlier this year and has already absorbed shocks ranging from large energy moves to a major leadership transition at the Fed. The factors that pushed gold higher previously are still present and, in some cases, intensifying. Slow growth combined with persistent inflation — the essence of stagflation — is precisely the environment that has historically favored physical gold.
Stay On Top of Gold & Silver Prices
Get important market alerts delivered to your inbox.
SOURCES
1. U.S. Bureau of Economic Analysis — Personal Income and Outlays, April 2026
2. U.S. Bureau of Economic Analysis — Q1 2026 GDP second estimate and corporate profits
3. U.S. Bureau of Labor Statistics — Consumer Price Index, April 2026
4. Federal Reserve — FOMC statement and minutes, April 2026
5. CME Group — Fed rate expectations (FedWatch tool)
6. Federal Reserve — Kevin Warsh sworn in as Chair, May 22, 2026
7. World Gold Council — historical gold price data and analysis
8. ProActive Advisor Magazine — research on gold’s performance under classic economic regimes
Disclaimer: This article is informational only and does not constitute financial or investment advice. Consult a qualified financial adviser before making investment decisions.
You May Also Like:
- Gold Targets Are Falling. The $8,000 Forecast Isn’t.
- Gold Radar: Five Stories the Price Chart Isn’t Telling You
- Silver Lost 3.3% While Gold Lost 1.6%. That Gap Is Not Random.
- Gold Down 1.2%, Silver Down 2.8% — The Floor Holds
- UBS Cut Its Gold Target — The Coverage You Should Watch
- Why Gold Is Falling Today — And Why $4,500 Is Holding
- Gold Is Down Today. Here’s Why Smart Money Is Still Buying.
- Silver Up 3%, Gold Up 1.3% — The Ratio Explains Market Moves
Popular Topics
Picked from the archive
-
01
 Topics
Why Investors Overlook Gold’s Inflation Paradox
-
02
Topics
US Economic Outlook: Surface Strength Masks Deep Risks
-
03
Topics
Gold +3%, Silver +4.7%: 5 Drivers Behind Today’s Metals Rally
-
04
Topics
Gold Price Outlook: Tariff Refunds, Weak Dollar, AI Bust
-
05
Topics
AI Bubble Fears Surge as Gold Price Falls Below 4,000 USD
-
06
Topics
Bond King Jeffrey Gundlach’s Gold Signal for Investors
-
07
Topics
Swiss Gold Exports Surge to the US Ahead of 39% Tariff
-
08
Topics
How to Buy Gold in 2026: A Step-by-Step Guide for New Investors