Warsh Says Wall Street Should Stop Watching the Fed: Gold Knew
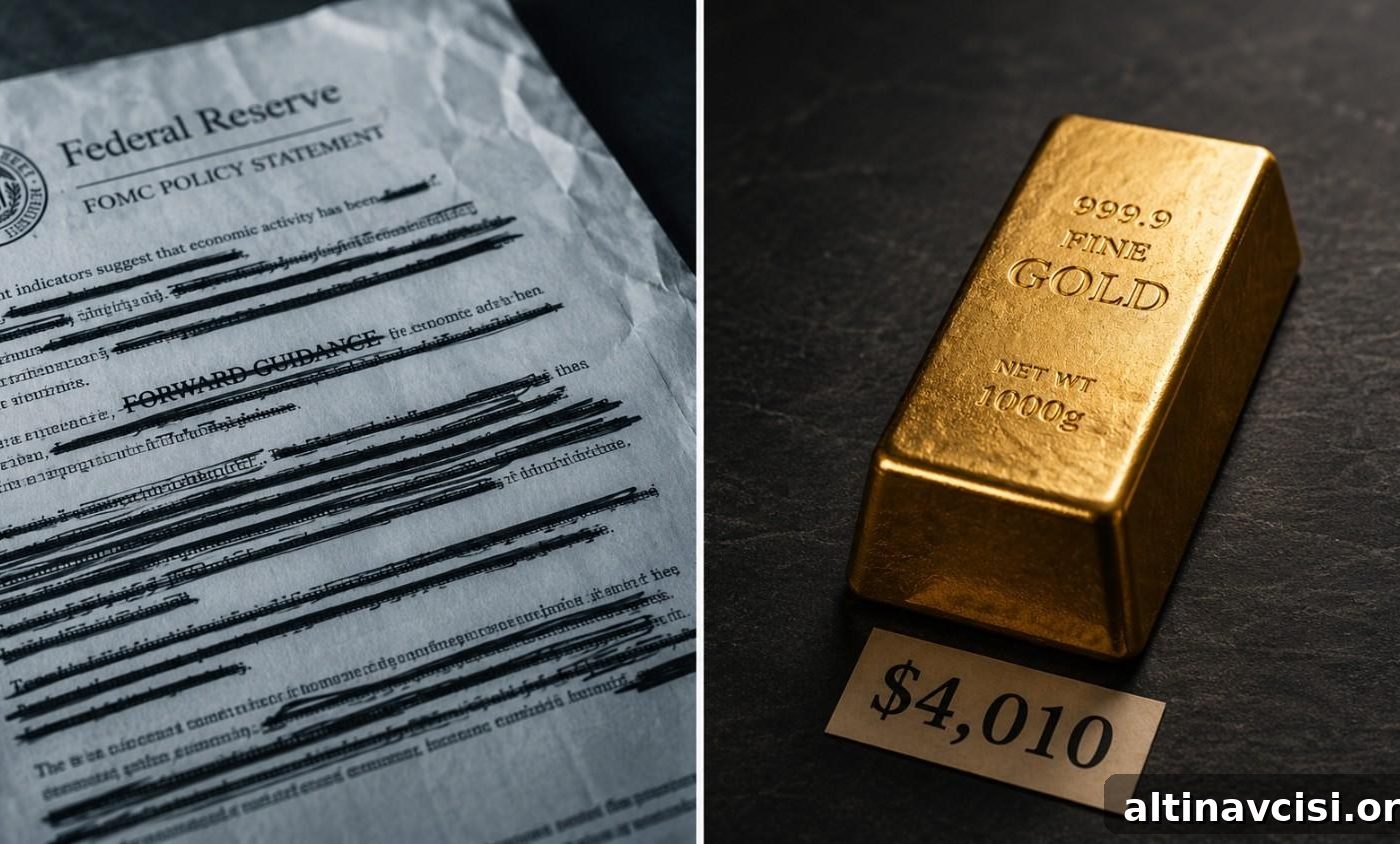
Federal Reserve Chair Kevin Warsh appeared before the Senate Banking Committee on Wednesday and delivered a clear message to markets: stop treating Fed talk as the market’s script. His instruction to Wall Street — “play the ball, don’t play the Fed” — signals a notable shift in how traders should interpret monetary policy signals going forward.
Explaining why he omitted his own rate projection from the June dot plot, Warsh said: “Figure out what’s happening in the real economy, respond to data that’s happening in the real economy, rather than somehow suggest that we’re going to be focused on Wall Street.” That guidance is especially consequential for gold investors, many of whom already trade directly from economic data rather than central bank rhetoric.
What Does “Play the Ball” Mean for Gold Prices?
On its face, Warsh’s advice is simple: respond to incoming economic indicators instead of forecasting policy moves from Fed statements. But in practice it marks a break with the last 14 years of Fed communications, during which the dot plot, press-conference language and carefully worded statements created a parallel market signal that often overshadowed raw data.
The dot plot, introduced in January 2012, became a focal point for traders. Warsh’s shorter first FOMC statement and his choice to withhold a personal dot reflect a deliberate move to dismantle that second market. He told Congress this approach is permanent, which forces participants to return to the fundamentals: the actual economic numbers. For gold, that means market direction will increasingly be set by CPI, PCE, retail sales, oil prices and other data rather than by forward guidance alone.

The Edge Every Investor Needs
Smarter precious metals investing starts here. Subscribe to the Nuggets Newsletter for concise market insights, Fed updates, and timely analysis.
Subscribe to receive alerts and analysis by email. (Form removed for a cleaner reading experience.)
Why Is Gold Down Today — and What Is the Data Saying?
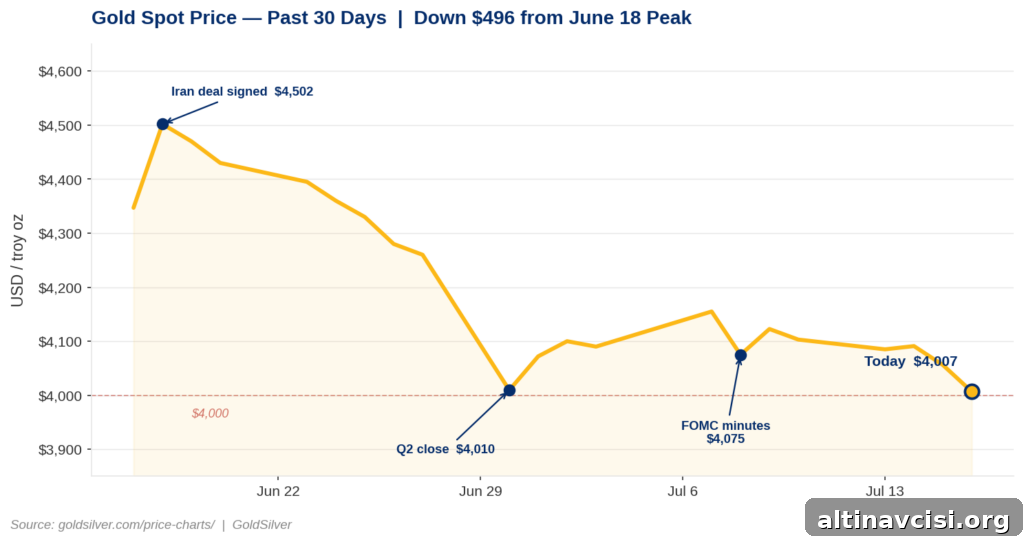
As of 11:45 AM ET, gold was trading around $4,010, down roughly $50 from the session open, while silver hovered near $56.38, off about 2.4% on the day. Those moves reflected three concrete data points rather than any new Fed rhetoric.
First, June’s Consumer Price Index fell 0.4% month-over-month — the largest single-month drop since April 2020 — bringing the year-over-year CPI to 3.5%, softer than the 3.8% consensus. That soft CPI briefly supported metals earlier in the week, though the CPI reading predates recent geopolitical developments that have since affected oil prices.
Second, advance retail sales for June rose 0.2% overall. Within that report, sales at gasoline stations fell 5.3% as pump prices eased, but core retail sales (excluding gasoline) increased by 0.7%. That resilience in consumer spending keeps the chance of a September rate hike on the table: current market tools put roughly a 44% probability on a September move.
Third, tensions in the Strait of Hormuz have re-escalated. Recent strikes and renewed naval pressure have pushed oil higher — more than 9% over five trading days — reviving an energy-driven inflation premium that June CPI only began to unwind.
The transmission mechanism is straightforward: higher oil prices lift forward inflation expectations, which push real yields up and raise the opportunity cost of holding non-yielding assets like gold. That sequence puts short-term pressure on gold prices — exactly the kind of data-driven dynamic Warsh encouraged traders to follow.
What Does This Mean If You Already Own Physical Gold?
Structurally, Warsh’s emphasis on raw data over forward guidance may be better for owners of physical metal over the medium and long term. Under the previous era, markets frequently moved on Fed language rather than on fiscal or monetary realities, enabling periods of policy misreadings. That dynamic contributed to the sharp inflation surprises of 2021–2022 when policy signals lagged underlying economic trends.
With forward guidance de-emphasized, the economy’s underlying metrics—debt levels, interest obligations, inflation readings, and real yields—become the primary drivers of price discovery. Those structural variables do not vanish simply because the Fed speaks less; in many cases they become clearer risks when central guidance recedes. Over time, allowing monetary fundamentals to determine price can create a more transparent and supportive environment for physical gold, which often benefits when inflation expectations and real yields are assessed directly by markets.
What Is the Next Number That Actually Matters?
Investors tracking gold and Fed policy in 2026 should note the FOMC meeting on July 28–29, but current market pricing assigns only about a 15–20% chance of a July rate hike. The more important release is July 30, when the June Personal Consumption Expenditures (PCE) index — the Fed’s preferred inflation measure — is published.
If June PCE confirms the softening seen in CPI and PPI, markets will likely push down the odds of a September hike. Lower odds for a September increase reduce real yields, easing a major headwind for gold and lifting its near-term prospects. Warsh has effectively told traders to focus on that kind of objective number: the data itself, not interpretive statements. Physical holders of gold have long traded that way; now the Fed chair is endorsing the approach.
That is not a warning but a description of how the system functions more cleanly: when markets price monetary fundamentals directly, the long-term case for physical metal rests on clearer footing.
Stay On Top of Gold & Silver Prices
Get important market alerts sent straight to your inbox.
Subscribe to receive timely gold and silver alerts and analysis. (Signup form removed.)
SOURCES
1. Federal Reserve — Chairman Warsh Semiannual Monetary Policy Testimony, July 14–15, 2026
2. Investing.com — Coverage of Warsh’s Senate testimony to the Senate Banking Committee, July 15, 2026
3. Bureau of Labor Statistics — Consumer Price Index, June 2026, released July 14, 2026
4. US Census Bureau — Advance Monthly Retail Trade Survey, June 2026, released July 16, 2026
5. Bloomberg — Reporting on Iran-US strikes and Strait of Hormuz developments, July 16, 2026
6. CME Group — FedWatch Tool, July 2026 rate probabilities
7. CNBC — Coverage of the June 2026 FOMC decision, dot plot and SEP details
Disclaimer: This article is for informational purposes only and does not constitute financial or investment advice. Always consult a qualified financial adviser before making investment decisions.
You May Also Like:
- Gold Falls as Retail Sales Confirm the Fed Has No Reason to Cut
- Silver Dropped 1.4% Today. Gold Didn’t. The Ratio Just Hit 70:1.
- Gold Holds as CPI and PPI Both Miss. Here’s Why.
- Gold Is Flat. Oil Is Up 9%. Here’s Why.
- Gold and Fed Policy: When the System Picks Winners
- Warsh Testified. Gold Jumped $90. The Signal Everybody Missed Was in His Report.
Popular Topics
Picked from the archive
-
01
 Topics
Key Indicator to Watch for Gold Ahead of Fed Decision
-
02
Topics
Gold and Silver Correction: Is the 2026 Bull Market Ending?
-
03
Topics
Inflation Holds at 3.0%, Gold Funds Post Historic Rally
-
04
Topics
China Ends Paper Gold Trading July 24: Why Physical Holders Win
-
05
Topics
Why Turkey Sold Its Gold and What It Means for Sound Money
-
06
Topics
Gold-to-Silver Ratio Hits 64: What It Means for Silver in 2026
-
07
Topics
Physical vs Digital Gold: Which Is the Safer Investment?
-
08
Topics
Gold Prices Surge: The Unexpected Reason