Gold and Silver Correction: Is the 2026 Bull Market Ending?

Key Takeaways
- Gold reached an all-time high of $5,589.38 on January 28, 2026, then corrected roughly 28% to about $4,046 by July 2026 — the steepest quarterly decline since 2013.
- Three clear, traceable forces drove the correction: the Federal Reserve’s hawkish pivot under Chair Kevin Warsh, the inflationary impact of the Iran conflict that pushed oil and inflation expectations higher, and large-scale profit-taking after gold’s 60%+ advance in 2025.
- The structural bull case remains intact: central banks continued heavy purchases (244 tonnes in Q1 2026), silver entered its sixth consecutive annual supply deficit, and gold grew as a share of global reserves relative to US Treasuries.
- Institutional valuation frameworks place gold’s fair value near $4,100 in mid-2026, with upside to $4,500 or more if macro conditions turn favorable.
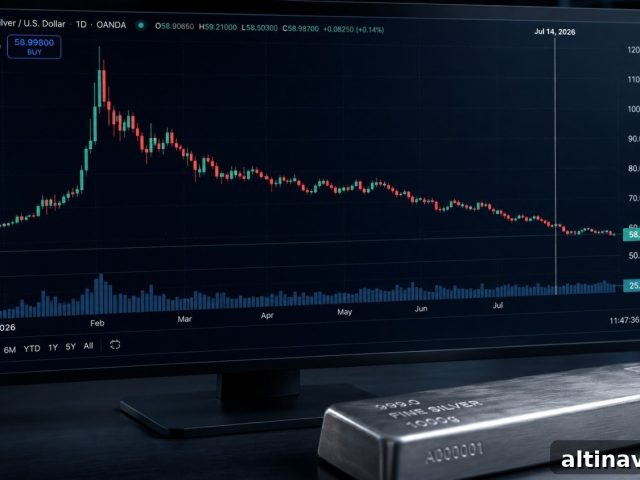
- Silver’s deeper correction — roughly 52% from its peak of $121.62 — reflects higher beta and industrial exposure, not a collapse in structural fundamentals.
Gold peaked at $5,589.38 on January 28, 2026. By late July 2026 it had retreated to about $4,046, a near 28% decline. Silver fell from an all-time high of $121.62 to approximately $58, a drop exceeding 50%.
For long-term holders the central question is straightforward: is the bull market over? The short answer is no. To understand why, it helps to examine the precise mechanisms that drove the 2026 correction — each was identifiable and, crucially, potentially reversible.
The Knowledge That Changes Everything
Two concise guides — free. Learn why gold matters and why fiat systems persistently degrade purchasing power.
What Caused the Gold and Silver Correction in 2026?
Three distinct factors combined to drive the correction. Each was traceable, and each can reverse under the right conditions.
1) The Fed pivoted more hawkishly than markets expected. Gold is highly sensitive to real (inflation-adjusted) yields: when real yields rise, gold typically falls. Markets had anticipated multiple rate cuts under the new Fed chair. Instead, the June 2026 policy outcome signaled a tighter stance and removed the expected rate-cut support that helped metals in 2025.
2) The Iran conflict produced an inflationary shock. Geopolitical risk normally helps gold, but in this cycle the US-Iran escalation pushed oil above $90 per barrel, lifting inflation expectations. That prompted markets to price out rate cuts and even consider hikes, which strengthened the dollar and raised real yields — headwinds for gold.
3) Profit-taking after an extraordinary rally. Gold rallied roughly 60% in 2025 and set numerous record highs. That extreme run-up left markets vulnerable to a sharp technical correction when the first two headwinds appeared. Heavy ETF selling and repositioning amplified the decline.
Combined, these dynamics produced the sharpest quarterly correction for gold since 2013 and a dramatic drawdown in silver, which naturally exhibits higher volatility.
Source: goldsilver price charts (live spot prices, July 21, 2026)
Is the 2026 Gold Bull Market Actually Over?
No. A bull market ends when the structural drivers that created it reverse. In gold’s case those drivers are: prolonged low real yields, persistent fiscal expansion, central bank diversification away from a single reserve currency, and broader de-dollarization. None of those structural forces has fully reversed.
Real yields did rise in 2026, but that change stemmed from the combination of an oil-driven inflation shock and a temporarily hawkish Fed response. Both are cyclical: a credible de-escalation in oil-driven inflation or slowing economic growth could unwind the yield move. In early July 2026, public commentary from Fed leadership indicated easing inflation risks, and gold responded positively.
On fiscal fundamentals, the US debt burden and growing interest costs remain large and rising, reinforcing the long-term case for assets that preserve purchasing power. Measuring from January 2020—when gold traded near $1,560—gold still sits substantially higher in mid-2026 even after the correction, underscoring the persistence of the underlying trend.
Why Did Silver Fall So Much Harder Than Gold?
Silver is a higher-beta metal. Its investable market is roughly one-tenth the size of gold’s, so equal flows create larger percentage moves. Around 58% of silver demand is industrial — for electronics, solar panels, EVs, and semiconductors — which makes silver sensitive to economic and rate-sensitivity concerns in addition to monetary demand.
The gold-silver ratio sat near 69:1 in mid-2026, above its 50-year average close to 65:1. Historically, that ratio compresses during later-stage rallies as silver outperforms. The persistent supply deficit in silver — projected as the sixth consecutive annual deficit in 2026 — also supports a longer-term constructive view despite the deeper short-term drawdown.
What Are the Structural Drivers That Have Not Changed?
Three pillars remain intact:
Central bank buying continues. Central banks remained active buyers in early 2026, adding hundreds of tonnes of net purchases over recent quarters. These are strategic reserve decisions, not short-term trades.
Gold’s share of reserves has grown. By mid-2026 gold accounted for a materially larger share of official reserves versus certain government bonds, reflecting a shift toward assets without counterparty or sanction risk.
De-dollarization is ongoing. The dollar’s share of global reserves has declined over decades. A more multipolar reserve landscape increases the structural importance of gold as a non-sovereign store of value.
What Do Institutional Forecasters Say About Gold Prices in the Second Half of 2026?
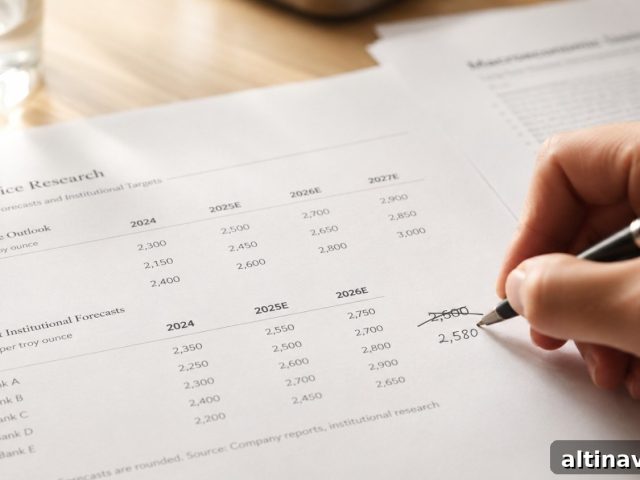
Mid-2026 institutional frameworks placed gold’s fair value near $4,100 per ounce under base-case assumptions, with a modest band around that level. Upside scenarios, where the Fed pivots or demand surges, point toward $4,500 or higher. Major banks offered differing targets for end-of-year and 2027, reflecting varying assumptions about real rates and demand — but few institutions project a return to pre-2025 levels.
Is This a Buying Opportunity for Gold and Silver?
It depends on your time horizon.
For short-term traders, near-term Fed meetings and inflation prints are the primary catalysts. A surprise policy move could push gold lower or send it higher quickly. For long-term investors, the structural case—real yield dynamics over time, fiscal pressures, and central bank demand—remains the dominant consideration. Historically, double-digit gold corrections have attracted institutional buying once valuation frameworks identify longer-term fair value ranges.
Silver offers a higher-risk, higher-reward profile given its industrial demand exposure and smaller market size. Its deeper drawdown and a wider gold-silver ratio create an asymmetric setup for investors comfortable with volatility and a multi-year horizon.
What Are the Key Risks That Could Extend the Correction?
Monitor three primary risks:
1) A surprise Fed rate hike. An unexpected tightening would likely lift real yields and weigh on precious metals.
2) Escalation of the Iran conflict. Further escalation could keep oil and inflation expectations elevated, sustaining a rate-hike outlook and extending pressure on metals.
3) Continued ETF outflows and sentiment-driven selling. Paper market flows can amplify moves. Persistent outflows could push prices toward institutional fair-value lower bounds before strategic buyers re-enter.
Stay On Top of Gold & Silver Prices
Receive concise market updates and alerts by email.
People Also Ask
Gold fell approximately 28% from its all-time high of $5,589.38 on January 28, 2026 to around $4,046 by July 21, 2026. This was the steepest quarterly correction since 2013.
Silver is structurally more volatile because its market is about one-tenth the size of gold’s and a majority of demand is industrial. When rate-hike expectations rise and recession fears increase, silver’s industrial component is repriced alongside its monetary demand, amplifying moves.
Three factors drove the correction: the Fed’s hawkish pivot under Chair Warsh, the inflationary impact of the Iran conflict that lifted oil prices and inflation expectations, and profit-taking after gold’s large gains in 2025.
Yes. Central banks continued net purchases in early 2026, maintaining an elevated pace of strategic reserve accumulation.
Institutional frameworks placed fair value near $4,100 under base-case assumptions, with upside scenarios to $4,500+ and a range of bank forecasts reflecting differing rate and demand views.
At about 69:1, the ratio is above its long-term average and historically signals that silver may be relatively inexpensive versus gold; in prior cycles the ratio compressed significantly when silver outperformed.
The Long-Term Investor Frame
The primary structural drivers for gold and silver that existed in early 2026—central bank demand, fiscal dynamics, de-dollarization, and silver’s supply deficits—remained in place in mid-2026. The correction was rapid and pronounced, but its causes were cyclical: an inflationary shock from geopolitics, a timely Fed reaction, and profit-taking after an exceptional rally. Those conditions altered price but did not erase the underlying thesis.
Measured from January 2020, when gold traded near $1,560, the metal still delivered a substantial multi-year gain even after the 2026 correction. For investors focused on preserving purchasing power over years rather than months, those structural forces matter far more than short-term volatility.
SOURCES
1. Gold and silver live price charts (goldsilver price charts, July 21, 2026).
2. World Gold Council — Gold Demand Trends Q1 2026 (Q1 2026 gold demand).
3. World Gold Council — Gold Mid-Year Outlook 2026.
4. Silver Institute / Metals Focus — World Silver Survey 2026.
5. European Central Bank — International reserve data and analysis (mid-2026 reporting).
6. Federal Reserve — June 2026 FOMC minutes and commentary.
7. Major bank research on gold price forecasts (mid-2026 updates).
8. US Treasury fiscal data — mid-2026 debt and interest payment figures.
9. IMF COFER — currency composition of official foreign exchange reserves.
Disclaimer: This article is for informational purposes only and does not constitute financial or investment advice. Consult a qualified financial adviser before making investment decisions.
You May Also Like:
- JPMorgan Cut Its Gold Forecast by 25%. Here’s What Long-Term Holders Need to Know.
- Why HSBC Still Believes Gold Hits $4,750 by Year-End (And What the Mainstream Is Missing)
- State Street Predicts $5,500 Gold by Q1 2027: Is the Dip Over?
- Why China’s Gold Buying Spree Outweighs India’s Pause
- What Is Purchasing Power — and Why Every Dollar You Save Is Slowly Being Taxed Away
- Why Hong Kong? Inside GoldSilver’s Offshore Gold Storage Network
- Silver Price Outlook July 2026: Two Catalysts, One Setup
Popular Topics
Picked from the archive
-
01
 Topics
Gold Price Showdown: Will It Hit $5,000 or Drop to $3,500?
-
02
Topics
Wall Street’s $6,000 Gold Call Relies on Hidden Data
-
03
Topics
July 2026 Silver Outlook: Two Catalysts Set to Move Prices
-
04
Topics
Gold Prices Up 21%, Silver 25% YTD Amid AI and Inflation Fears
-
05
Topics
Gold Price Outlook June 2026: CPI Impact and Fed Signals
-
06
Topics
WGC Q1 2026: Asian Insights Wall Street Overlooks
-
07
Topics
Silver Jewelry vs Silver Bullion: A Buyer’s Guide
-
08
Topics
Why OCBC Cut Its Gold Forecast by $740