Wall Street’s $6,000 Gold Call Relies on Hidden Data

J.P. Morgan projects gold to reach near $6,000 per ounce by late 2026. That headline figure is driven less by short-term market trading and more by a substantial gap between official central bank reporting and the World Gold Council’s estimates of actual central bank buying.
Key takeaways
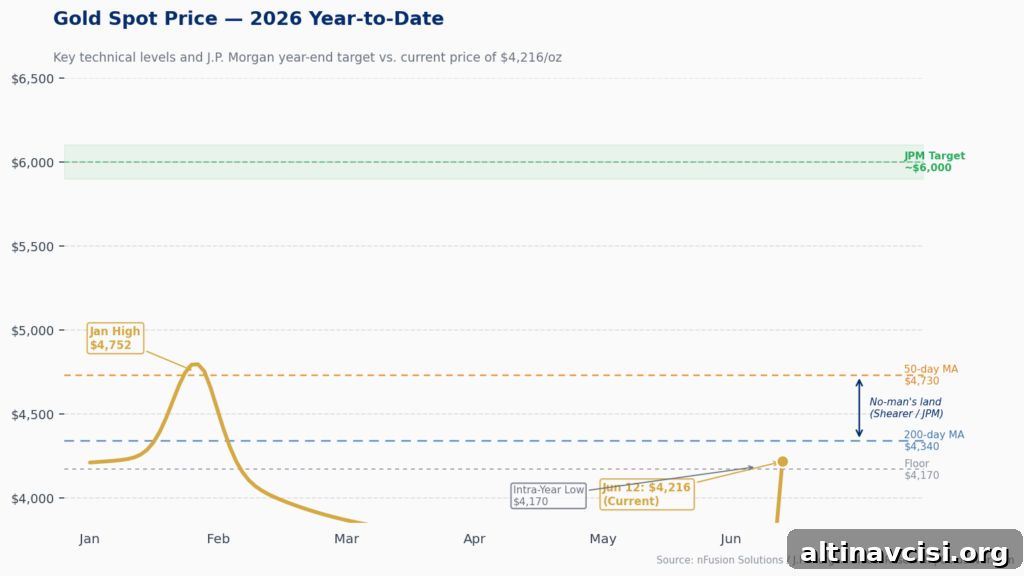
- Gold is trading at $4,216/oz (as of the article’s data), roughly 12% below its January high near $4,752. J.P. Morgan’s year-end path implies about a further 42% rise from current levels.
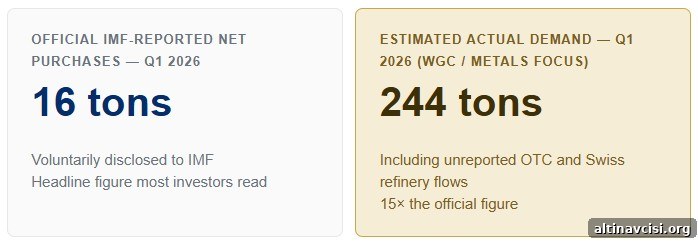
- Official IMF-reported Q1 2026 central bank net purchases were 16 tons, while the World Gold Council estimates actual central bank demand at 244 tons — a gap that exists because reporting to the IMF is voluntary.
- China’s disclosed buying accelerated, with the People’s Bank of China increasing announced purchases from about 1 ton per month to 8 tons in April 2026. Chinese net gold imports reached 317 tons in Q1.
- China’s insurance sector gained regulatory approval to allocate up to 1% of assets to physical gold for ten major insurers, implying substantial potential structural demand.
- The principal downside risk to the bullish view is a stronger-than-expected US tightening cycle, driven by energy-led inflation, which could lift real yields and weigh on Western ETF demand.
What is the real data behind the $6,000 gold price forecast?
The dramatic difference between official IMF-reported central bank purchases and independent estimates is the foundation of the $6,000-per-ounce projection. Official data recorded only 16 tons of net central bank purchases in Q1 2026. By contrast, the World Gold Council’s methodology — which incorporates London over-the-counter flows and Swiss refinery trade — estimates central bank demand at 244 tons for the same quarter. That roughly 15-fold difference explains why institutional forecasts appear far more bullish than surface-level reports suggest.
Put simply: the headline price targets are flow models, not guesses. They depend on an assumption of sustained, large-scale accumulation by sovereign and institutional buyers that often do not disclose purchases through IMF reporting.
What is J.P. Morgan’s gold forecast for 2026 — and what drives it?
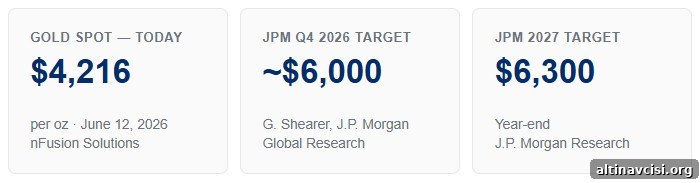
J.P. Morgan Global Research expects gold to approach $6,000 per ounce by Q4 2026 and to move toward $6,300 by the end of 2027. Its revised full-year 2026 average forecast is $5,243 per ounce, down from an earlier projection, reflecting weaker short-term investor participation and lighter ETF positioning.
Gregory Shearer, Head of Base and Precious Metals Strategy at J.P. Morgan, describes the market as range-bound but supported: gold has been trading between key moving averages while investors watch potential Fed responses to energy-driven inflation. That combination has temporarily dampened retail and ETF momentum, even as structural buyers continue to accumulate.
Other large institutions have varied targets: Goldman Sachs’ year-end estimate sits lower than J.P. Morgan’s peak projection, while some banks and analysts have suggested even higher long-term scenarios. The important point is that many of these outlooks are driven by long-term flows from central banks and large institutions rather than short-term sentiment swings.
Are central banks still buying gold? The official answer and the real one
Official IMF data for Q1 2026 implies weak central bank demand, showing net purchases of only 16 tons and even listing notable sellers. However, those numbers reflect voluntary reporting, not a full accounting of global activity. The World Gold Council’s estimate of 244 tons is built from alternative trade and OTC data and suggests that actual central bank demand has remained substantial.
The discrepancy is structural: many sovereign buyers do not disclose acquisitions promptly, and there is no mandatory global reporting regime. As a result, headline IMF figures can materially understate real accumulation by central banks.
Why is China buying so much gold — and who is doing the buying?
China appears to be a major unreported buyer. Net Chinese gold imports were reported at 317 tons in Q1 2026, nearly triple the prior quarter. The People’s Bank of China increased its public monthly disclosures, from roughly 1 ton per month earlier in the year to 5 tons in March and 8 tons in April. Those disclosed flows likely understate total institutional and sovereign accumulation within China’s broader system.
Strategically, China’s increased purchases reflect a desire to diversify reserves away from dollar-denominated assets that may be vulnerable to sanctions or freezes. Physical gold held outside dollar-based systems cannot be seized in the same way as foreign-currency reserves, making it attractive as a geopolitical and monetary hedge.
Beyond the central bank, China’s insurance sector is emerging as a structural buyer. In early 2025, regulators permitted ten major insurers to allocate up to 1% of assets to physical gold. At that allocation level, combined demand could equal hundreds of tons — a material addition to global consumption if fully deployed. These institutional holdings are not yet required to be publicly disclosed, so observed inflows may only be a portion of total accumulation.
What are the risks to gold’s price outlook in 2026?
Gold’s primary vulnerability is its lack of yield. If real rates rise — particularly as the Federal Reserve tightens policy in response to persistent, energy-driven inflation — yield-bearing assets become more competitive and gold can underperform. J.P. Morgan has already trimmed its expected Western ETF inflows for 2026 to reflect that risk.
Geopolitical developments also matter. A de-escalation of regional conflicts would remove a portion of the risk premium supporting gold. Conversely, ongoing geopolitical uncertainty reinforces the structural case for non-yielding safe-haven assets and for sovereign diversification away from dollar assets.
What gold’s sideways move is actually telling you
Gold’s recent trading range — roughly $4,170 to $4,730 — reflects absorption rather than indecision. The market is digesting large flows: sovereign sales from some countries, reduced ETF momentum in the West, and the potential for a more hawkish Fed. Yet the price has held within a relatively tight band, which indicates that the buyers with the greatest influence — central banks, sovereign institutions, and large, long-duration allocators — are accumulating through the pause rather than exiting.
Historically, comparable headwinds would have pushed gold materially lower. The smaller-than-expected drawdown suggests a change in the underlying structure: higher sustained central bank buying, the emergence of new institutional demand in China, and strategic reserve diversification that is unlikely to reverse quickly on a single macro release.
What should gold investors watch for the rest of 2026?
Monitor Federal Reserve communications closely. Any clear signal of renewed rate hikes — especially in response to energy-driven inflation — would likely compress investor sentiment and encourage ETF outflows. Fed language around wage and employment strength will be especially important.
Also follow China’s monthly disclosures from the People’s Bank of China and any public reporting from large Chinese insurers. Continued monthly PBOC purchases at elevated levels would help establish a price floor that does not rely on Western investor flows. When China’s institutional buyers begin disclosing holdings more comprehensively, markets may uncover even greater structural accumulation than currently visible.
The $6,000 forecast should be viewed as a model based on observed and estimated flows rather than a simple price prophecy. Understanding the true scale and persistence of central bank and institutional demand is essential to interpreting that projection.
The Knowledge That Changes Everything

Two concise guides — free. Learn why gold matters for portfolios and why many institutions treat it as a strategic reserve asset.
Stay On Top of Gold & Silver Prices
Get important market alerts sent straight to your inbox.
People Also Ask
What is J.P. Morgan’s gold price forecast for 2026?
J.P. Morgan expects gold to approach $6,000 per ounce by the fourth quarter of 2026 and to move toward $6,300 by the end of 2027. Its revised full-year 2026 average forecast is $5,243 per ounce, reflecting reduced near-term investor participation and lower expected ETF inflows.
Are central banks still buying gold in 2026?
Yes. Official IMF-reported net purchases were modest in Q1 2026, but independent estimates show far larger demand. Because reporting is voluntary, many sovereign purchases do not appear in IMF tallies. Alternative data sources indicate central bank buying has remained substantial.
Why is China buying so much gold?
China’s accumulation is largely strategic: diversifying reserves away from dollar assets and building holdings that cannot be frozen or debased by sanctions. Both the People’s Bank of China and major Chinese insurers have increased gold activity, contributing to a structural rise in demand.
What is the biggest risk to gold prices in 2026?
The biggest risk is a stronger US tightening cycle that raises real yields. Higher real returns on Treasuries and money-market instruments would reduce the relative appeal of non-yielding gold and could trigger sustained outflows from Western ETFs.
Why does official central bank gold data understate actual buying?
Reporting to the IMF is voluntary. Many sovereign buyers either delay disclosure or do not report purchases at all. Organizations such as the World Gold Council use alternative trade and OTC data to estimate total demand, and those estimates consistently exceed official figures.
SOURCES
J.P. Morgan Global Research — Gold price projections; World Gold Council — Gold Demand Trends Q1 2026; bank and analyst surveys and research referenced by major financial institutions and industry bodies.
Disclaimer: This article is for informational purposes only and does not constitute financial or investment advice. Consult a qualified financial adviser before making investment decisions.
You may also like:
- Silver Eagle vs. Maple Leaf vs. Britannia: Which Gives You More Silver?
- Gold Price Outlook June 2026: What CPI and the Fed Mean
- How Gold Price Is Set: The East-West Tide Explained
- Does Physical Gold Have Counterparty Risk? The Facts
- Why Is Gold Still a Safe Haven? Switzerland’s Biggest Refiner Just Answered.
- Rate Hike Odds Just Hit 85%. Gold Is Up. Here’s Why.
- Gold Confiscation: Could the Government Take Your Gold Again?
- Gold Price History: From $35 to $4,500 in 100 Years
- The Debasement Trade Explained: Mechanism, History, and What It Means for Gold
Popular Topics
Picked from the archive
-
01
 Topics
Why Gold Prices Are Falling Despite Global Turmoil
-
02
Topics
Gold Price Nears $5,000 as Silver Approaches $100
-
03
Topics
Why Investors Are Buying Gold After Today’s Price Drop
-
04
Topics
Barclays’ $4,791 Target Unchanged as Gold Drops 26%
-
05
Topics
5 Signs Gold’s Correction Is a Reset, Not a Reversal
-
06
Topics
GoldSilver: One Account for Home Storage and Secure Vaults
-
07
Topics
Gold Targets Are Falling, but the $8,000 Forecast Holds
-
08
Topics
Gold Fell During War: Is It Still a Safe Haven?