Why OCBC Cut Its Gold Forecast by $740
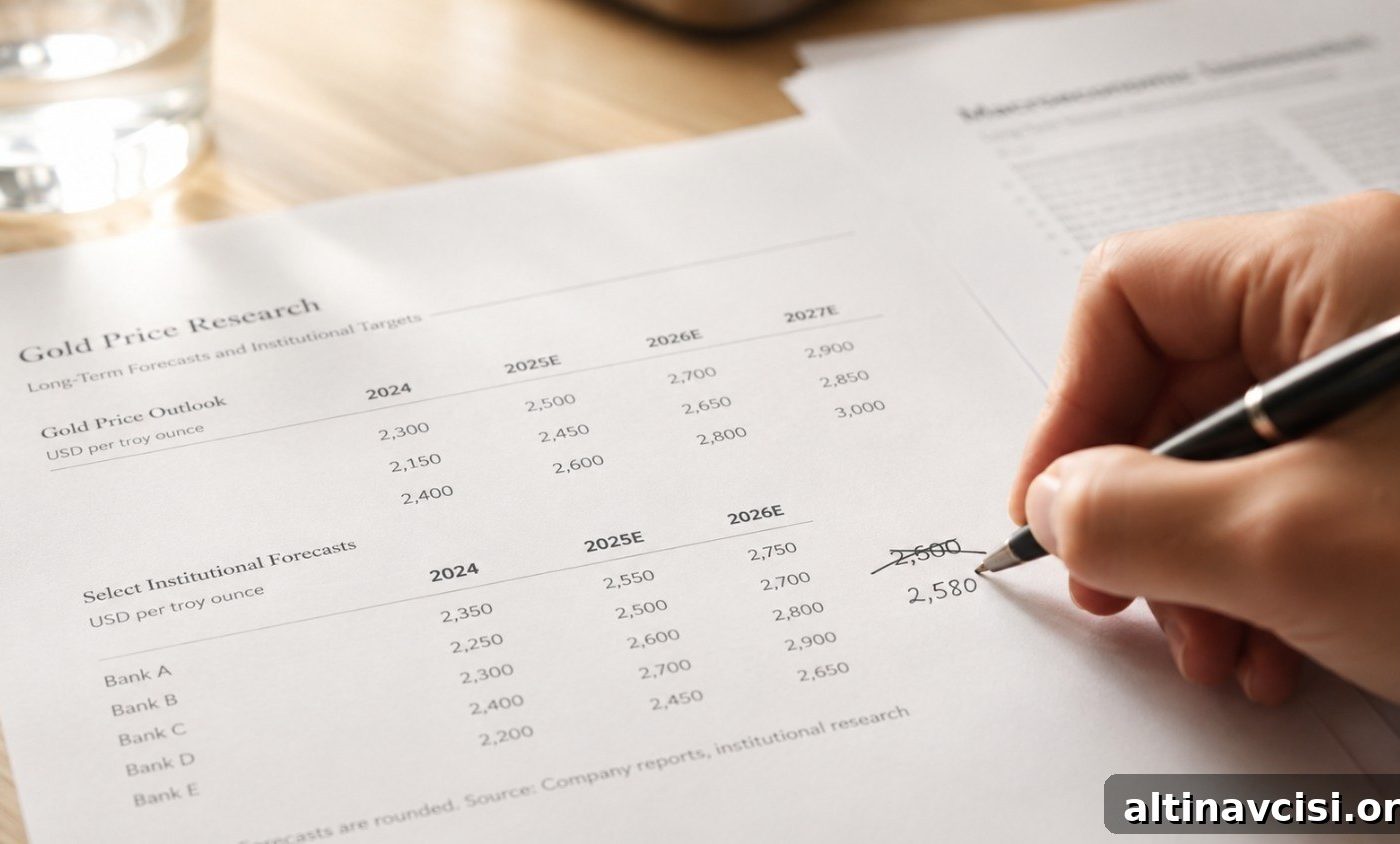
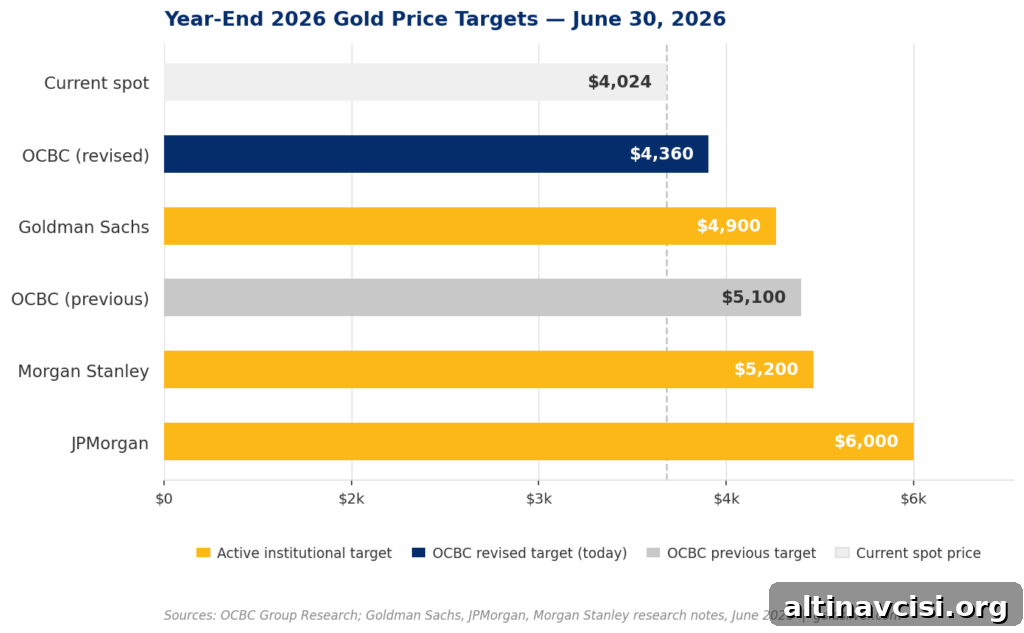
Gold opened this morning near $4,023 per ounce after OCBC (Oversea‑Chinese Banking Corporation), one of Southeast Asia’s largest banks, sharply revised its year‑end gold forecast downward. The bank cut its target from $5,100 to $4,360 and reduced its silver forecast from $89.50 to $67. Earlier in the year OCBC had been projecting a peak near $5,600. That $1,240 swing between highs and the current call is the story: it highlights what is driving the near‑term correction in precious metals pricing.
What OCBC Actually Said
OCBC’s revision shaved roughly $740 off its gold year‑end forecast and about 25% off its silver outlook. The bank cited four central drivers for the downgrade: higher real yields, a stronger U.S. dollar, a more hawkish Federal Reserve, and weakening ETF demand. Importantly, OCBC emphasized that it has not abandoned the structural case for precious metals — central bank buying remains robust and silver supply deficits persist — but that the timing has changed.
In short, OCBC is not arguing that gold is no longer a strategic store of value. It is saying the near‑term macro backdrop no longer supports the higher price it expected earlier in the year.
Why OCBC’s Gold Forecast Changed
OCBC’s earlier, more bullish forecast assumed a Fed easing cycle, a softer U.S. dollar, and sustained investor interest in gold and silver. Since that projection was published, those assumptions have reversed. The geopolitical shock from the U.S.‑Iran conflict that began on February 28 pushed energy prices higher, which in turn lifted inflation expectations. As inflation rose, the Federal Reserve abandoned a path toward rate cuts and markets began to price in a continued or renewed tightening bias.
Higher nominal rates and rising inflation expectations drove real yields — the inflation‑adjusted return on Treasury securities — upward. When real yields increase, fixed income instruments compete more effectively with gold, which pays no yield. That dynamic pressures gold prices in the paper markets where ETFs, futures, and institutional allocations respond quickly to rate and currency shifts.
OCBC adjusted its model to reflect a delayed Fed pivot and a firmer dollar. Its structural view on gold and silver’s long‑term roles did not change; the bank simply revised the expected timing for when those long‑run drivers will dominate price action again.
Why Other Banks Still Forecast Higher Prices
Not every major institution followed OCBC’s downgrade. Goldman Sachs trimmed its year‑end target but still sees prices closer to $4,900, Morgan Stanley remains much more bullish, and JPMorgan’s forecasts have stayed even higher. The divergence largely reflects time horizon and emphasis. Some banks are focused on structural drivers — particularly central bank reserve flows — that operate independently of short‑term rate expectations.
Central bank accumulation is a multi‑year, policy‑driven trend that started accelerating after major reserve freezes and sanctions in recent years. Those purchases are driven by long‑term reserve strategy rather than quarterly Fed projections, and they can keep upward pressure on gold over an extended period even while short‑term macro factors cause temporary price weakness.
What This Means for People Who Own Physical Metal
OCBC’s revision mainly reflects expectations in the paper market — ETFs, futures positioning, and institutional flows that move quickly with rate and currency repricings. Physical gold and silver owners are less directly affected by short‑term ETF flows. Physical metal retains its role as a hedge against currency depreciation and systemic risk; it does not pay interest, but it preserves purchasing power when cash yields are negative or when inflation outpaces bank deposit rates.
If you hold coins or bars, OCBC’s updated model does not change the metal in your possession. The bank’s forecast explains likely price paths in markets that are sensitive to yield and currency shifts. Investors should distinguish between paper‑market volatility and the long‑term case for owning physical precious metals.
SOURCES
1. Investing.com — OCBC Group Research: Gold and Silver Forecasts Revised Lower, June 30, 2026. 2. OCBC — FX and Commodities Market Insights, 2026. 3. Bloomberg reporting on Goldman Sachs’ year‑end gold forecast change, June 19, 2026. 4. J.P. Morgan Global Research — gold price outlooks for 2026–2027. 5. CME Group — FedWatch Tool for market‑implied rate probabilities. 6. Council on Foreign Relations — background on frozen Russian reserves and sanctions. 7. Market price feeds and historical charts for gold and silver.
Disclaimer: This article is for informational purposes only and does not constitute financial or investment advice. Consult a qualified financial adviser before making investment decisions.
You May Also Like:
- Gold Is Closing Its Worst Quarter Since 2013 — A War Helped Cause It
- Strong Jobs Data Could Move Gold Again — Why Employment Reports Matter
- How the Fed’s Dot Plot and Policy Signals Affect Precious Metals
- Central Bank Buying vs. ETF Outflows — The Divergent Signals for Gold
- Understanding the Gold‑Silver Ratio: Why Silver Can Look Weak While Accumulation Occurs
Popular Topics
Picked from the archive
-
01
 Topics
401(k) Rollover to a Gold IRA: Step-by-Step Guide
-
02
Topics
Gold Price Hits $4,200: What This Means for Investors
-
03
Topics
France Completes Gold Repatriation, Germany Set to Follow
-
04
Topics
How to Sell Gold and Silver Safely and Avoid Scams
-
05
Topics
Silver Price Nears $50: Will It Break Its All-Time High?
-
06
Topics
Gold vs. Stocks 2026: Q1 Returns Investors Need to Know
-
07
Topics
Silver Squeeze Pushes Silver Prices Above $51
-
08
Topics
Moody’s: 50% of U.S. Industries Cutting Jobs Amid Recession Risk