Garner Predicts $3,600 Gold Floor – Could Prices Fall?

Key Takeaways
- Gold has corrected about 28% from its January 28, 2026 all-time high of $5,589 as the Federal Reserve under Chair Kevin Warsh signals a tighter-dollar policy.
- Warsh, confirmed May 13, 2026, has stated his intent to withdraw excess liquidity and reduce the money supply — a policy directly at odds with the monetary debasement dynamics that supported gold’s rise.
- Commodities trader Carley Garner of DeCarley Trading expects a durable floor in the $3,600–$3,700 range before a major buying opportunity returns.
- Institutional forecasts differ sharply: Goldman Sachs lowered its year-end 2026 target to $4,900 while JPMorgan’s forecast remains near $6,000 — a $1,100 gap reflecting a genuine debate over drivers of gold.
- The long-term structural case for gold — persistent fiscal deficits, broad central-bank buying, and multi-decade money supply expansion — is not erased by a single Fed chair’s actions, even if it can alter the near-term path.
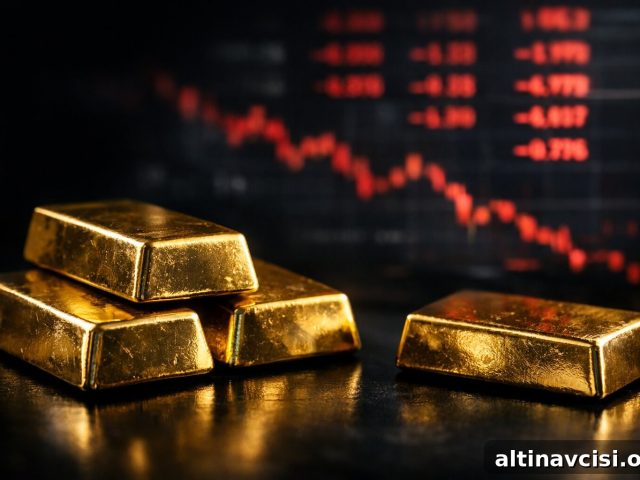
Is gold likely to decline further? That is the central question for precious-metals investors today. After reaching a record $5,589 per ounce on January 28, 2026, gold fell roughly 28% to trade around $4,024 as of July 1, 2026. The dominant explanation is a change in U.S. monetary policy under Fed Chair Kevin Warsh, who has signaled a willingness to shrink the money supply directly rather than rely solely on rate adjustments. Whether this marks a temporary reset or a structural regime shift depends on whether the Fed can actually reverse years of monetary expansion or merely slow its pace.
Technicals have also turned bearish: a death cross occurred on June 29, 2026 when the 50-day moving average crossed below the 200-day, a signal that many short- to medium-term traders watch closely. That combination of policy and technical pressure explains why buyers who entered positions since late 2025 currently show paper losses.
What Is the Debasement Trade, and Why Does It Drive Gold?
Gold produces no yield; its investment case is tied to what happens to the currency used to price it. When central banks expand money faster than real economic growth, each unit of currency loses purchasing power. That gradual erosion is monetary debasement, and it has been the most consistent tailwind behind gold for the past two decades.
The arithmetic is instructive. Over recent decades the Federal Reserve’s balance sheet expanded dramatically and M2 money supply rose multiple times over. Over the same period gold climbed substantially. This relationship is driven by real yields: when nominal interest rates sit below inflation, real yields are negative and holding cash or short-term deposits erodes purchasing power. Gold, which preserves value across long time horizons, becomes a logical alternative. When real yields turn positive, gold typically faces headwinds. That transmission mechanism is central to the debate over whether gold will fall further under the Warsh Fed.
The Knowledge That Changes Everything
Two essential guides — free. Learn why gold matters and how fiat currency dynamics influence wealth preservation.
What Does Kevin Warsh’s Policy Mean for Gold?
Kevin Warsh was confirmed as Federal Reserve Chair in mid-May 2026. Before presiding over a full policy cycle, he made clear he prefers to shrink the money supply directly rather than rely exclusively on interest-rate hikes. Shrinking the supply reduces the quantity of dollars in circulation, which tends to strengthen the currency and push up real yields — conditions that typically weigh on gold.
This approach is more ambitious than conventional tightening and, if successfully implemented, presents a meaningful headwind to the debasement-driven case for precious metals. Market participants reacted quickly: the first FOMC cycle under Warsh showed several officials prepared to signal additional tightening, and markets priced that hawkish shift into risk assets and commodities.
“He wants to pull money out of the system, reduce the money supply, which boosts the dollar. I think he’s trying to control inflation with a stronger dollar. That’s not good for gold or silver or copper or pretty much any commodity.”
— Carley Garner, DeCarley Trading, June 2026
Garner predicts speculative flows that supported metals will unwind and find their way into dollar-denominated assets such as Treasury securities. She identifies a potential durable floor for gold around $3,600–$3,700 per ounce if liquidation continues into the summer.
What Are Major Banks Predicting for Gold in 2026?
Institutional forecasts differ notably. Goldman Sachs revised its year-end 2026 target downward to $4,900 in June, citing lower ETF inflows and the removal of anticipated rate cuts. By contrast, another major bank maintained a target near $6,000, emphasizing continued sovereign and central-bank demand. The roughly $1,100 spread between these views reflects a core debate: is gold’s path determined chiefly by policy-driven real yields or by longer-term reserve accumulation by central banks? Which view proves correct will shape gold’s trajectory through the remainder of 2026.
Why the Structural Case for Gold Persists Even if the Fed Tightens
A Fed chair can tighten policy and even slow monetary growth, but he cannot erase accumulated fiscal obligations. The United States carries very large public debt and faces substantial interest and deficit pressures that make long-term fiscal accommodation likely. Those structural pressures argue that any meaningful and lasting reversal of the long-term trend toward monetary expansion would require sustained fiscal change, which is ultimately political.
Central banks outside the U.S. have continued to add gold to reserves. Those official buyers are repositioning over years and decades rather than trading short-term policy signals. Continued sovereign accumulation and persistent fiscal imbalances mean the long-run drivers behind gold remain in place, even if near-term price action reflects a stronger dollar and higher real yields.
What Does This Correction Mean for Long-Term Gold Holders?
First, clarify your reason for owning gold. If your goal is long-term protection against currency debasement and fiscal stress, a price pullback changes the entry point but does not necessarily invalidate the thesis. By contrast, if your position relied on a short-term bet that the Fed would cut rates soon, that thesis has weakened under the current policy stance.
Another important distinction is the instrument you own. Paper gold — futures, ETFs and leveraged positions — is sensitive to margin calls, liquidity flows and technical positioning. Physical, allocated gold held in secure custody does not face margin calls or counterparty claims; it can behave differently in periods of stress. Understand which exposure you hold and the risks that accompany it.
Stay On Top of Gold & Silver Prices
Get market alerts delivered to your inbox.
People Also Ask
Why is gold falling in 2026?
Gold fell about 28% from its January 2026 record. The primary driver is the shift in U.S. monetary policy under the new Fed chair, who has signaled an intent to reduce money supply and strengthen the dollar. That policy path tends to lift real yields and raise the opportunity cost of holding non-yielding assets like gold.
What is the gold price prediction for 2026?
Institutional forecasts vary. Some major banks lowered year-end targets to the mid-$4,000s, citing weaker ETF inflows and a firmer Fed path. Others remain more bullish, driven by expectations of sustained central-bank buying. Independent traders have outlined potential floors in the $3,600–$3,700 area. The wide range reflects differing views on whether policy or sovereign demand will dominate.
What is the debasement trade, and is it over?
The debasement trade is the strategy of owning gold to hedge against loss of purchasing power from monetary expansion. Whether it is over depends on longer-term fiscal and reserve trends. Short-term monetary tightening can slow or pause that trade, but large fiscal deficits and continued central-bank gold accumulation suggest the structural forces remain.
Should I buy gold during a correction?
That depends on your investment rationale. If you seek long-term protection against currency debasement, a correction can improve entry prices. If you were betting on imminent rate cuts, the current environment weakens that case. Also consider the form of exposure: physical allocated gold behaves differently from paper or leveraged positions.
How does Fed policy affect the gold price?
Fed policy influences gold mainly through real yields — nominal interest rates adjusted for inflation — and through the money supply. Negative real yields historically favor gold, while positive real yields increase the appeal of yield-bearing assets. A policy explicitly aimed at reducing money supply and strengthening the dollar represents a more direct challenge to gold’s bull case than rate hikes alone.
Is Gold Going Lower? The Honest Framework
Gold may move lower in the near term. A scenario that pushes it toward the $3,600–$3,700 range is plausible if the Fed’s money-supply reduction gains traction and if real yields and the dollar both trend higher. At the same time, a sustained re-acceleration of fiscal pressures or uninterrupted central-bank gold buying would support higher prices over a longer horizon.
To assess whether this correction deepens or reverses, monitor three key indicators: M2 money supply growth, the U.S. Dollar Index, and real yields derived from inflation-protected securities. If all three consistently move against gold, the correction likely continues. If they reverse, the recent sell-off may prove to be a temporary reset and a buying opportunity for long-term holders.
Sources (selected)
1. Gold and silver live price data and historical charts
2. London Bullion Market Association — LBMA gold price data and history
3. World Gold Council — gold price data, central bank statistics, and demand trends
4. Research notes from major investment banks and commodity analysts (June 2026)
5. Federal Reserve public releases and Summary of Economic Projections (June 2026)
6. U.S. Treasury debt statistics and fiscal data (June 2026)
Disclaimer: This article is for informational purposes only and does not constitute financial or investment advice. Consult a qualified financial adviser before making investment decisions.
You May Also Like:
- Why Is Gold So Expensive? The 5 Mechanisms Behind the Price
- Gold vs. Savings Account: Which Is Actually Beating Inflation Right Now?
- Seigniorage: The Hidden Tax on Every Dollar You Hold
- Gold’s Regulatory Role in Bank Collateral and Funding
- Research on Gold’s Price Floor and Market Dynamics
- Questions to Ask Before Choosing a Gold Storage Provider
- Explaining Goldman Sachs’ Gold Target Revision
Popular Topics
Picked from the archive
-
01
 Topics
Why BRICS Nations Are Stockpiling Gold
-
02
Topics
Gold Prices Fall to Seven-Month Low as Geopolitical Fear Fades
-
03
Topics
CPI-Adjusted Silver vs Spot Price: What the Ratio Reveals
-
04
Topics
Shutdown Nears Deadline as Gold Soars 12% in September
-
05
Topics
Gold Price Up 1.5% as ADP, ISM and Beige Book Weigh on Fed
-
06
Topics
Silver vs Gold 2026-2031: 5-Year Investment Outlook
-
07
Topics
US Jobless Claims Jump to 3-Month High, Point to Labor Softening
-
08
Topics
How Fed Pause and Rising PPI Affect Gold Prices