No Tankers Crossed Strait of Hormuz; Oil Tops $89, Gold Flat

Shipping through the Strait of Hormuz effectively halted this past weekend. Ship-tracking data from Kpler, cited by Reuters, recorded zero cargo-carrying vessels transiting the strait on Sunday, August 16 — down from five on Saturday and 31 the previous weekend. The Islamabad Memorandum of Understanding between the United States and Iran, signed June 17, 2026, included a 60-day clause intended to guarantee safe commercial passage; that 60-day window expired this weekend. Iran’s foreign ministry disputes that the memorandum imposed a binding deadline, and no replacement agreement has been announced.
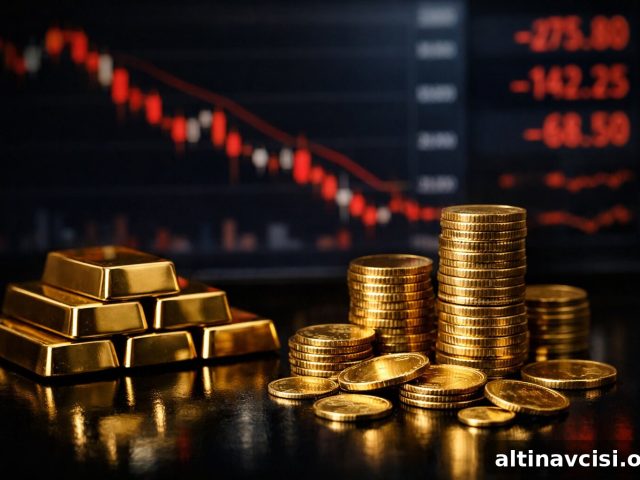
Markets reacted quickly. Brent crude surged, touching as high as $89.40 per barrel on Monday morning. Precious metals, however, barely moved: gold traded near $4,378 per ounce — essentially unchanged on the day — while silver hovered around $65.15, up roughly 0.7%.
That near-flat gold price in the face of a collapsing Hormuz transit and rising crude is the key signal in this story. It reveals how the oil-to-gold transmission chain is behaving today and why the market’s response is more subtle than headline logic would suggest.
Sources cited: Kpler ship-tracking data via Reuters/CNBC, August 17, 2026 | Gold price source referenced.
Why Is Gold Holding While Oil Surges on Hormuz News?
At first glance, a shut strait that threatens global oil flows should lift gold immediately. Historically, major supply disruptions have pushed investors toward the monetary metals. But the direct link — oil up, inflation expectations up, the Fed forced to raise rates, real yields rise, and gold falls or underperforms — is operating differently right now.
Higher oil prices typically raise inflation expectations. Those expectations pressure central banks to tighten policy, which increases real yields (bond returns after inflation) and reduces gold’s relative appeal because gold yields no interest. That mechanism explains why gold underperformed earlier in the conflict: persistent oil-driven inflation kept the possibility of higher Fed rates alive, supporting real yields and pressuring gold.
Today that chain is fraying. The Federal Reserve left the policy rate at 3.50%–3.75% at the July 28–29 meeting; three committee members dissented in favor of an immediate hike, but the committee majority held. Since then, several data points softened: July retail sales fell, the University of Michigan consumer sentiment index dipped to 51, and July CPI rose only 0.1%. Market-implied odds of a September hike have dropped materially. Prominent economists have signaled that a September increase is now unlikely in light of weakening data.
Put simply, the ceiling that previously constrained gold is lifting. With rate-hike expectations fading, real yields are less likely to rise further — a change that structurally favors gold. The modest move in gold prices is therefore not an anomaly; it reflects a market where the inflation-to-rate transmission is weakening even as oil ticks higher.
What Does the Hormuz Shutdown Mean for Gold Going Forward?
The longer-term picture is more nuanced than a simple “oil up, gold up” storyline. The Strait of Hormuz handles roughly one-fifth of global oil consumption and about one-quarter of seaborne oil trade. If tanker traffic remains effectively at zero for an extended period, energy prices are likely to stay elevated and the risk of higher inflation persists. That places the Federal Reserve in a difficult position: hiking rates into a supply-driven energy shock risks tipping the economy into recession; holding rates risks allowing inflation to accelerate. Either outcome complicates monetary policy.
For owners of physical gold, both policy paths can be constructive over time. If the Fed hikes to counter inflation, growth expectations may compress and the case for hard assets can strengthen. If the Fed holds to avoid choking growth, real yields can remain low, supporting gold’s price floor. In short, physical gold sits largely outside the policy trade-offs facing the central bank: paper gold reacts to rate expectations, while physical metal reacts to the limits of what the financial system can absorb.
Institutional flows already point to renewed interest: global gold ETFs recorded net inflows in July 2026 that reversed prior outflows, raising holdings by roughly 23 tonnes to about 4,068 tonnes, according to industry data. That movement indicates institutions were returning to gold before this weekend’s Hormuz developments.
What Is the Diplomatic Status of the US-Iran Negotiations?
Diplomatically, conditions are less hopeful than they were a fortnight ago. Iranian officials have said they have not decided to resume talks with the United States. The UAE reported that an ADNOC vessel was struck while transiting the strait on August 14, the third such reported incident in less than a week; Iran’s Revolutionary Guard Corps has not publicly acknowledged responsibility. On the US side, the president warned Americans to expect somewhat higher gasoline prices while the conflict persists.
There are reports of ongoing bilateral discussions between Iran and Oman about potential arrangements for shipping routes, but no agreement has been announced. Key near-term policy and market events include the release of FOMC minutes (from the July meeting) and a major central-bank speech at Jackson Hole; both are likely to influence rate expectations and, by extension, gold’s near-term trajectory.
What Does the Hormuz Situation Mean for Physical Gold Holders?
The structural case for holding physical gold remains intact and, if anything, has grown more compelling. Two plausible scenarios point to upside or defensive strength for the metal:
- Diplomacy breaks through and shipping restarts: oil prices would likely ease, inflation expectations would soften, and the Fed could more comfortably hold rates. That environment could give gold room to advance toward resistance levels watched by analysts.
- The shutdown persists: energy prices remain elevated, inflation risks stay live, and the Fed faces a policy trap. In that case, the monetary argument for gold strengthens and physical holdings should retain their structural floor.
Either path supports the thesis that gold is not positioned to collapse; instead, it is sitting on a firm structural foundation and awaiting a catalyst that clarifies the policy outlook.

The Edge Every Investor Needs
Smarter precious metals investing starts here. The Nuggets Newsletter delivers market insights, Fed updates, global trends and educational content.
SOURCES
1. Kpler / Reuters — Strait of Hormuz vessel transit data, August 15–16, 2026. (news outlets reported these data)
2. Industry reporting on oil price movements and US-Iran negotiations, August 2026.
3. World Gold Council — Gold ETF flows and holdings, July 2026.
4. Market price references for gold and silver as noted in market data summaries, August 17, 2026.
Disclaimer: This article is for informational purposes only and does not constitute investment advice. Past performance is not indicative of future results. Consult a qualified financial advisor before making investment decisions.
You May Also Like:
- Gold Rebounds to $4,392 as Sentiment Crashes to 51 and Inflation Expectations Rise
- Gold Price and the September Fed Pivot: Five Data Prints Rewrote the Odds This Week
- The Fed’s September Math Just Changed. Here’s What It Means for Gold.
- Jackson Hole Is 14 Days Away. What Warsh Says Could Move Gold More Than Any Inflation Print.
- Gold Hit a Two-Month High. Then It Pulled Back. The PPI Data That Caused Both Moves Is What Matters.
- Two Soft Inflation Prints. Gold Is Still Below $4,500. One Number Is Keeping It There.
Popular Topics
Picked from the archive
-
01
 Topics
Gold Prices Stabilize Amid Saudi-Iran Tensions
-
02
Topics
Why Gold Held Steady After Trump’s Economic Pressure on Iran
-
03
Topics
Oil Drops 11% as Gold Rises: What Investors Need to Know
-
04
Topics
3 Questions Investors Must Ask Before Buying Any Asset in 2026
-
05
Topics
Silver Surges Past $70 Amid Conflicting GDP Data
-
06
Topics
What’s Moving Gold and Silver Prices This Week
-
07
Topics
How FOMC Minutes and Jackson Hole Could Move Gold
-
08
Topics
Two Investors Ran Debt Math Separately and Chose 15 Percent Gold