Iran Missile Strikes Spark 6% Oil Rally, Gold Falls
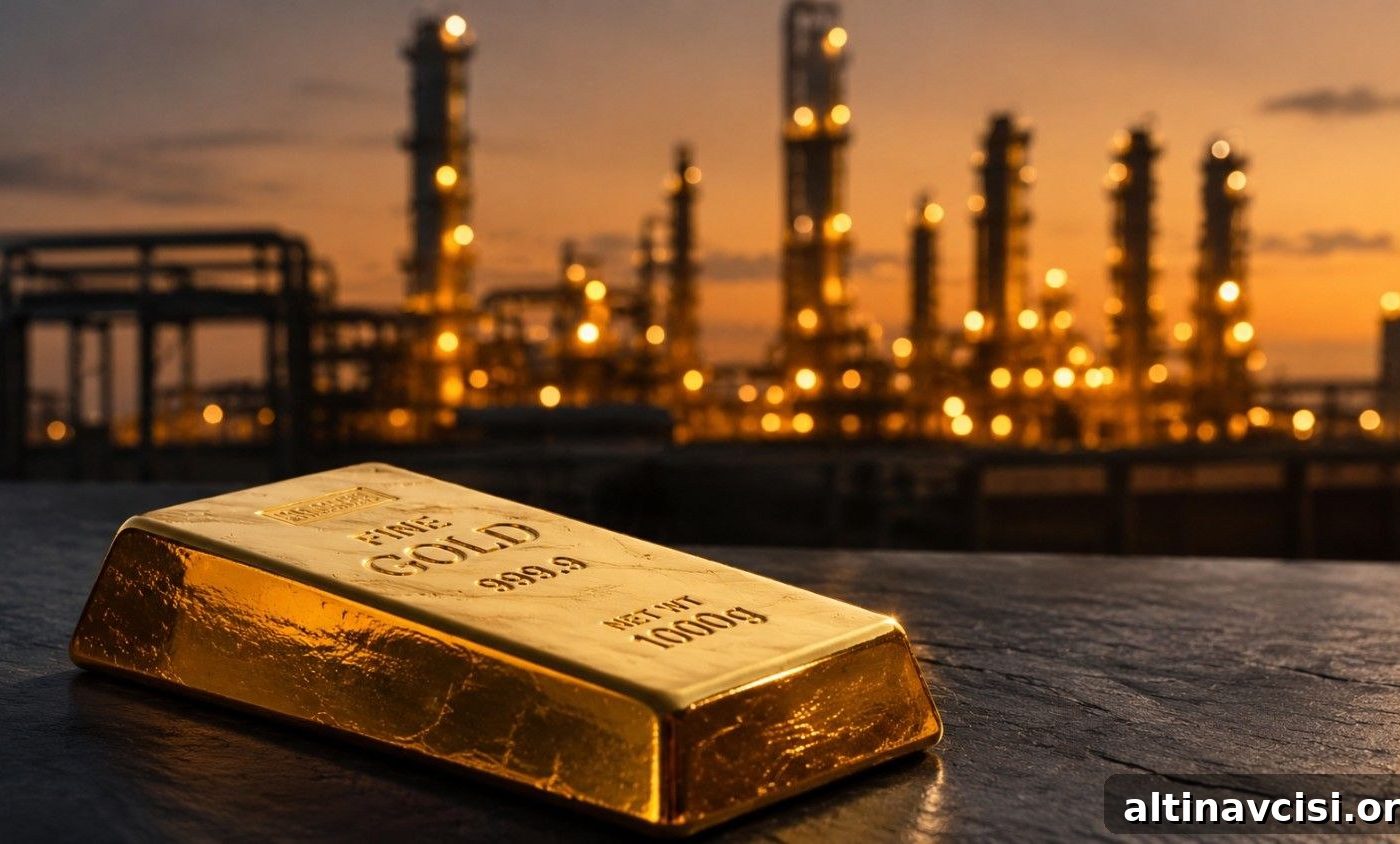
Iran’s Revolutionary Guard launched a surprise ballistic missile salvo at American forces in the Middle East overnight. US forces intercepted every missile. Oil spiked more than 6 percent. Gold moved the opposite way and slipped. If that sequence feels counterintuitive, this article lays out the transmission mechanism step by step — why a conflict-driven oil shock can initially pressure gold, and why the longer-term structural case for precious metals remains intact.
What Happened Overnight Between Iran and the US?
Shortly before midnight on Tuesday, Iran’s Islamic Revolutionary Guard Corps fired multiple ballistic missiles at US forces stationed in the Middle East. US Central Command confirmed the launches and said US defenses intercepted the missiles. President Trump told Fox News early Wednesday that the US intended to retaliate, saying, “We’ll be hitting them hard. They’re going to get a beating.”
The attack ended a brief four-day pause in hostilities that had earlier pushed oil down about 14 percent. Once the missiles were launched, Brent crude prices jumped more than 6 percent on Wednesday morning toward the $90-per-barrel area. For many investors, a rising risk premium from war escalation and sharply higher oil would ordinarily point to rising gold. Yet gold traded lower — near $4,010 in the immediate session referenced here — falling roughly half a percent on the day. That apparent contradiction is explained by how energy, inflation expectations and central bank policy interact.
Why Is Gold Falling When a War Just Got Bigger?
The answer follows a three-step transmission chain that headlines often skip.
Step one: The missile attack lifts oil prices by reviving fears of disruption to the Strait of Hormuz, the critical chokepoint for a large share of global seaborne oil trade. A credible supply scare immediately raises the expected path for energy costs.
Step two: Higher oil feeds directly into inflation expectations. Because the Federal Reserve watches inflation expectations and incoming price data closely when setting policy, a sustained oil spike increases the chance of tighter monetary policy or a longer period without easing.
Step three: Higher expected short-term interest rates raise the opportunity cost of holding a non-yielding asset like gold. When investors can earn more from interest-bearing instruments such as Treasuries, gold’s relative attraction can weaken in the near term.
Put simply: the war pushed oil up; higher oil pushed inflation expectations up; higher expected rates pushed the opportunity cost of gold up — and that monetary channel, not geopolitics alone, explains why gold fell even as geopolitical risk jumped.
What Do the Fed Rate Odds Look Like Right Now?
At the time of the events described here, the Federal Open Market Committee (FOMC) was in the middle of a two-day meeting that concludes with a policy decision at 2 p.m. ET. Market pricing showed roughly two-thirds of traders expecting a hold at 3.50–3.75 percent and about one-third pricing in a 25 basis-point hike — an unusually high level of uncertainty this close to a decision (CME FedWatch, July 29, 2026).
More important for markets, however, was the forward view: more than three-quarters of traders were pricing at least one hike by September. That forward expectation, not just the immediate decision, exerts substantial pressure on gold because it alters the expected profile of real interest rates and the yield available to fixed-income investors.
Does This Mean the Structural Case for Gold Has Changed?
No. Distinguishing a near-term tactical headwind from a longer-term structural trend is crucial.
The immediate pressure from rising rate expectations is real and can compress gold prices for days or weeks. But structural buyers who supported the move from below $2,000 in early 2024 to the January 2026 peak above $5,500 are driven by multi-year mandates and portfolio diversification decisions, not by a single missile intercept or a single Fed meeting. For example, China’s central bank continued adding to its gold reserves in June 2026, marking its twentieth consecutive month of purchases (World Gold Council, July 2026). Such persistent reserve diversification is a long-term driver that does not disappear because of short-run market noise.
Similarly, the silver market faces supply constraints that are structural. As reported by the Silver Institute, 2026 was projected to be the sixth consecutive annual supply deficit, with demand outstripping supply by a large margin. That kind of structural imbalance supports prices over the medium and long term irrespective of rate-meeting headlines.
What Should Gold Holders Watch After 2 p.m. Today?
Focus on two things.
First, the FOMC vote tally. The composition of the vote communicates as much as the decision itself. A unanimous hold signals committee-wide comfort with the current stance. A split vote, with dissents in favor of higher rates, signals that a hawkish faction is gaining influence and makes September a more likely hike meeting.
Second, the next inflation data release: the June Personal Consumption Expenditures (PCE) price index, which is the Fed’s preferred inflation gauge. Because recent CPI data came in softer than expected in the referenced period, the PCE reading will be watched closely. A softer-than-expected PCE would reduce pressure for near-term tightening and could help relieve some downward pressure on gold. A hotter-than-expected PCE would do the opposite.
Stay On Top of Gold & Silver Prices
Get important market alerts and timely analysis delivered to your inbox to help you make informed decisions about precious metals.
SOURCES
1. GoldSilver — Live Gold and Silver Spot Prices
2. US Central Command — Reports on Iran’s missile launches
3. Reuters / QZ — Coverage of Brent crude moves after the attack
4. CNBC — Reporting on US response comments
5. CME Group — FedWatch Tool, July 2026 FOMC rate probabilities
6. CNBC — Analysis of gold in relation to the Fed decision
7. Federal Reserve — FOMC meeting calendars and policy statements
8. World Gold Council — China gold market update, June 2026
9. Silver Institute — World Silver Survey 2026
10. Bureau of Economic Analysis — Personal Income and Outlays / PCE price index schedule
Disclaimer: This article is for informational purposes only and does not constitute financial or investment advice. Consult a qualified financial adviser before making investment decisions.
You May Also Like:
- Everyone Is Watching the Fed. Gold Is Watching Tomorrow at 8:30 a.m.
- Gold Is Down $48. Here Are the Five Reasons Why.
- Consumer Confidence Fell for the Third Month in a Row. Gold Fell Too. They’re Not the Same Signal.
- Hike Odds Doubled. Gold Is Down $46. Here Is Why.
- The Fed Votes Wednesday. Watch the Tally, Not the Decision.
- Oil Dropped 7%. Gold Rose. Here Is the Mechanism Everyone Misses.
Popular Topics
Picked from the archive
-
01
 Topics
Gold Price Showdown: Will It Hit $5,000 or Drop to $3,500?
-
02
Topics
Wall Street’s $6,000 Gold Call Relies on Hidden Data
-
03
Topics
July 2026 Silver Outlook: Two Catalysts Set to Move Prices
-
04
Topics
Gold Prices Up 21%, Silver 25% YTD Amid AI and Inflation Fears
-
05
Topics
Gold Price Outlook June 2026: CPI Impact and Fed Signals
-
06
Topics
WGC Q1 2026: Asian Insights Wall Street Overlooks
-
07
Topics
Silver Jewelry vs Silver Bullion: A Buyer’s Guide
-
08
Topics
Why OCBC Cut Its Gold Forecast by $740