Gold Price Faces Bull Momentum vs Policy Ceiling by Thursday

Gold opened higher on Monday but gave back most of its gains by mid-morning — a pattern that illustrates the current tug-of-war in precious metals. Short-term bullish drivers repeatedly collide with a persistent policy-driven cap, creating a narrow trading range that reflects two opposing forces in balance.
Five distinct developments are shaping the market for gold and silver this week. Each feeds into the same central dynamic: any bullish catalyst is often offset by expectations of tighter monetary policy, while every bearish headline encounters a structural support beneath it. Understanding that interplay is more valuable than tracking any single news item.
As of Monday, August 3, 2026, spot quotes showed gold near $4,031 per ounce and silver around $57.12, according to industry price charts.
What Does the Iran Airstrike Pause Mean for Gold Prices?
Gold futures opened roughly 0.7% higher Monday, briefly pushing to about $4,135 per ounce, driven by reports that planned U.S. airstrikes on Iran were paused for a second weekend. Silver futures also reacted, opening about 1.5% higher on the same headlines.
But both metals trimmed gains through the morning session. Iranian officials denied active direct talks with the United States, saying discussions were limited to Oman-brokered talks about the Strait of Hormuz. Because the Strait remains a possible chokepoint for oil flows, the underlying energy-driven inflation outlook did not materially change. In short, the geopolitical risk premium softened at the open, yet the fundamental mechanism that links higher oil prices to Fed hawkishness remains intact. The pattern — open on the geopolitical headline, then retreat as policy expectations reassert themselves — is exactly the market’s current condition.
The Edge Every Investor Needs
Smarter precious-metals investing begins with concise market insight: Fed signals, global trends, and practical analysis delivered for investors.
Why This Week’s Jobs Data Matters for Gold
This week brings the most consequential U.S. labor-market releases of the summer for precious-metals investors: JOLTS job openings, the ADP private payrolls estimate, weekly jobless claims, and the July nonfarm payrolls report on Thursday, August 7. Consensus forecasts suggest roughly 88,000 jobs added in July versus a soft June print of 57,000.
The importance is straightforward: the labor data directly influences expectations for the Federal Reserve’s September 15–16 meeting. A stronger-than-expected payrolls report would increase the probability of a September rate hike, supporting a firmer dollar and raising the opportunity cost of holding non-yielding assets like gold. Conversely, a weak report could reopen the possibility of a prolonged pause. For traders and investors, Thursday’s jobs number is the key scheduled catalyst this week.
Why Are Three Fed Officials Still Pushing for a Rate Hike?
The Federal Reserve left rates unchanged at its July 29 meeting, but the decision recorded a 9–3 split. The three dissenting officials who preferred an immediate hike have continued to press their view publicly, warning that delaying action could force more aggressive tightening later. That stance keeps a rate-hike narrative alive and helps explain why markets assign a meaningful probability — fluctuating in intraday trading — to a 25-basis-point move at the September meeting.
Energy prices linked to the Iran conflict remain the primary argument for the hawks. Fed leadership has emphasized returning inflation toward the 2% target, and while the timeline is not specified, the presence of dissenters creates a clear policy ceiling for precious metals. A rally above roughly $4,100–$4,150 faces this tightening-overhang until the Fed’s next decision clarifies the path forward.
What the Bank of America Forecast Cut Means for Long-Term Holders
In early July, Bank of America trimmed its 2026 average gold forecast by about 14%, setting a near-term target of $4,360 per ounce and citing a more hawkish Fed as the main reason. Importantly, the bank did not abandon its longer-term bullish view: it still expects gold to reach $5,000 once the current tightening cycle ends.
That distinction matters for physical holders. The forecast reduction signals a timing delay, not a reversal of gold’s structural case. It also publicly confirms a key point: policy decisions, rather than a breakdown in fundamentals, are largely responsible for the market’s recent price suppression. For long-term investors, that framing is clarifying rather than alarming.
Is the U.S. Economy Sending a Structural Warning Signal for Gold?
Macro data presents a mixed picture. GDP growth slowed in Q2 2026 to an annualized 1.5%, down from 2.1% in Q1, and June nonfarm payrolls were far softer than expected, adding only 57,000 jobs versus a consensus of about 110,000. Household-level metrics also point to strain: low-income consumer savings rates have fallen significantly.
At the same time, concentrated investment in mega-cap technology and data-center spending — projected in the hundreds of billions — skews headline strength. The result is a K-shaped economy: a prosperous, investment-led segment produces resilient top-line numbers while much of the broader consumer base shows signs of weakening. That divergence reinforces the real-case argument for gold and silver, because eroding purchasing power for households amid nominal GDP growth tends to favor stores of value. Institutional behavior supports that view: central banks recorded record quarterly gold purchases in Q2 2026, signaling durable demand from official buyers even as retail sentiment softened.
The Single Mechanism Connecting All Five Stories
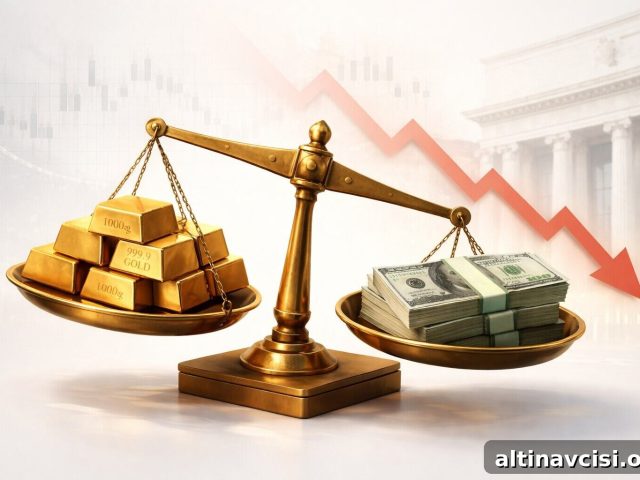
Each of the developments above feeds the same compression: a strong structural case for precious metals constrained by a policy ceiling. Cooling labor-market signals, a weakening consumer, record central-bank buying, and long-term institutional forecasts point toward higher gold prices over time. Yet Iran-driven energy risks and a still-hawkish Federal Reserve create an overhead rate-hike narrative that limits near-term rallies.
The market at roughly $4,031 is not indecisive; it is precisely balanced between these forces. That balance will break sharply once the Fed’s September decision either confirms a hike or removes it from the table. For holders of physical metal, the structural case remains intact and the policy cap is temporary. The critical question for the coming week is which of these five forces shows the first clear sign of giving way.
Stay On Top of Gold & Silver Prices
Get timely market alerts and concise analysis delivered to your inbox.
SOURCES
1. Yahoo Finance — Coverage of gold prices and the paused airstrike headlines (August 3, 2026).
2. Yahoo Finance — Coverage of silver prices reacting to paused airstrikes (August 3, 2026).
3. KuCoin — Analysis of gold trading range and Fed rate-decision implications.
4. Yahoo Finance — Preview of the July jobs report and market implications.
5. U.S. Bureau of Labor Statistics — Employment situation releases and data series.
6. Federal Reserve Board — FOMC statement, July 29, 2026.
7. CNBC — Coverage of market reaction to the Fed decision and related comments.
8. BNN Bloomberg — Report on Bank of America’s 2026 gold forecast revision.
9. Bureau of Economic Analysis — Q2 2026 GDP advance estimate.
10. Bureau of Labor Statistics — Employment Situation Summary, June 2026.
11. World Gold Council — Gold Demand Trends, Q2 2026.
12. GoldSilver.com — Live gold and silver spot prices and charts.
Disclaimer: This article is informational only and should not be taken as financial or investment advice. Consult a qualified financial adviser before making investment decisions.
You May Also Like:
- The Same Force That Crushed Gold All Year Just Flipped
- Gold ETFs Lost Tonnes Last Quarter; Central Banks Bought Heavily—What the Split Means
- Gold Had Every Reason to Rally Today. It Didn’t. Five Reasons Why.
- Central Banks Bought a Quarterly Record of Gold While Prices Fell.
- PCE Movement and Gold: Why the Fed Said It Wasn’t Enough to Change Course.
- Gold at $4,100 and Silver Below $60: Five Signals That Will Define the Next Six Weeks.
Popular Topics
Picked from the archive
-
01
 Topics
Central Banks Favor Gold Over the Dollar: Impact on Your Savings
-
02
Topics
Record Gold ETF Outflow Sparks Debate as China Disagrees
-
03
Topics
Is Gold Still a Safe Haven in War? Investor Insights
-
04
Topics
Gold Near $4,330 as 70% Rate-Hike Odds Rise, China Intervenes
-
05
Topics
Jobs Beat, Ceasefire, Deficit: Impact on Gold Prices
-
06
Topics
Silver Price Spikes to $69.85, FOMC Erases Gains
-
07
Topics
Banks Forecast Gold Over $5,400 After Greenland News
-
08
Topics
Why Gold Climbed After an 8% Oil Spike — What’s Different