The Trend That Crushed Gold All Year Just Reversed

Gold is higher this morning, trading near $4,038 per ounce, while Brent crude has dropped more than 5%. These moves are linked: the same market dynamics that have driven precious metals all year are operating in reverse today.
Below is a clear explanation of what happened, why it matters, and which data releases over the next four days will likely determine the short-term direction for gold and silver.
Why Did Gold Rise Monday Morning?
Late Saturday, former President Trump posted on Truth Social that Iran and several Middle Eastern countries had asked the United States to delay a planned strike and that “the perimeters of a deal has been agreed to.” According to that post, the prospective deal would include full reopening of the Strait of Hormuz and steps toward ending Iran’s nuclear program.
Markets reacted immediately. When Asian trading opened Monday, Brent crude fell more than 5% to roughly $83 per barrel and West Texas Intermediate declined over 6% to about $79. OPEC+ also approved a modest September production increase of 188,000 barrels per day, which added further downward pressure on oil prices.
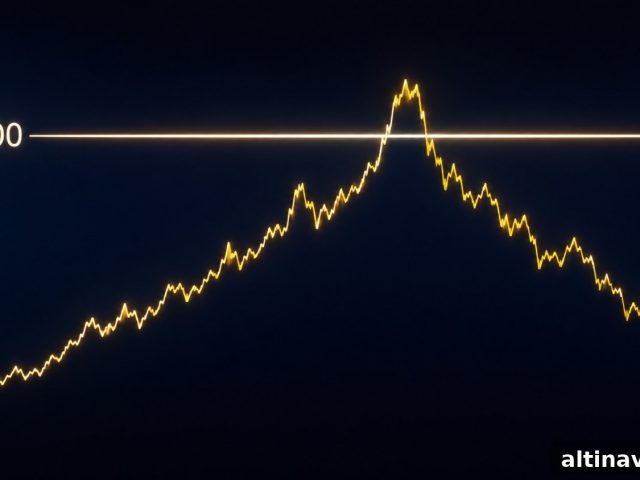
Gold spot price vs. Brent crude, January–August 2026. The two assets have tended to move in opposite directions since the US–Iran conflict began on February 28.
Lower oil is currently bullish for gold because of a three-step transmission mechanism. First, falling energy prices ease energy-driven inflation. Second, lower inflation reduces pressure on the Federal Reserve to raise interest rates. Third, when rate-hike expectations soften, real yields fall—making zero-yielding assets like gold relatively more attractive compared with Treasury yields. Over most of 2026 this relationship has caused gold and oil to diverge.
Is the Iran Deal Real — and Why Does That Matter?
This is the key question for investors.
Iran’s government has denied the claim, calling it “a new lie,” and officials say the armed forces remain on high alert. The Strait of Hormuz remains effectively closed and shipping disruptions continue. At present, no formal agreement has been signed.
That means Monday’s market move likely reflects a short-term easing of tensions—essentially a 48-hour reprieve from immediate escalation—rather than a confirmed diplomatic settlement. Since the conflict escalated on February 28, 2026, headlines about ceasefires or tentative deals have repeatedly surfaced and collapsed. Each time, oil has moved sharply and gold has responded through the same oil–inflation–rates mechanism described above.
A genuine, confirmed reopening of the Strait of Hormuz would be different: sustained lower energy inflation would reduce hawkish pressure across major central banks and could allow the Fed to pause or even consider rate cuts later in the year. That outcome would strengthen the structural case for both gold and silver more directly.
For now, the market is pricing in a temporary de-escalation. The move in gold is real; the diplomatic deal is not.
What Economic Data Will Move Gold This Week?
The Federal Reserve left its policy rate unchanged at 3.50%–3.75% last Wednesday, in a 9–3 vote. Three regional Fed officials dissented in favor of an immediate 25-basis-point hike, which briefly raised the odds of a September rate increase. Oil’s decline on Monday has likely trimmed those odds slightly, but market probabilities change daily.
Four economic releases this week will be especially important because each can materially reprice expectations for September and therefore move gold:
Tuesday, August 4 — JOLTS (June job openings): A softer-than-expected JOLTS reading would reduce rate-hike odds and support gold. A stronger reading would push the market toward higher odds of another Fed hike, weighing on metals.
Wednesday, August 5 — ADP (July private payrolls): The ADP report serves as an early read on Friday’s official payrolls number and can shift sentiment on labor-market momentum.
Friday, August 7 — BLS Nonfarm Payrolls (July): This is the week’s main event. June payrolls were much weaker than expected, and a similarly soft July print would further reduce the probability of a September hike. A strong payrolls print would do the opposite.
Each of these releases will reprice September rate expectations and, through the interest-rate/real-yield channel, move gold and silver.
What Does the Broader Picture Say About Gold and Silver Right Now?
The short-term mechanism that drove the 2026 correction—war-driven oil inflation pushing up rate expectations—is temporarily reversing. But the broader structural reasons to hold gold and silver remain unchanged.
Central banks continued to buy large quantities of gold: according to the World Gold Council, quarterly purchases reached a record 289 tonnes in Q2 2026, a significant year-on-year increase. Silver is also facing persistent supply constraints, moving toward its sixth consecutive annual supply deficit. Separately, the US government’s annual interest expense has surpassed $1 trillion, which imposes a practical limit on how aggressively fiscal and monetary policy can tighten without creating broader fiscal stress.
Gold finished July with a modest monthly gain—its first since February—and has held near $4,000 through intense geopolitical headlines, a visibly split Fed, and oil that briefly approached $90 per barrel. At $4,038, gold remains far below its January 28, 2026 record high of $5,589, yet structural buyers—especially central banks—have continued to accumulate during the correction.
In short, watch Tuesday’s JOLTS report. It is the first concrete data point that will influence September rate-hike probabilities and set the tone ahead of Friday’s payrolls release.
SOURCES
1. NBC News — U.S. agrees to pause attacks on Iran, Trump says
2. NPR — Trump says he’s cancelling Iran strikes, deal pending
3. Bloomberg — Trump Holds Off Iran Strikes on Pledge Hormuz Deal Is Close
4. Al Jazeera — Why has Trump halted Iran attacks, and what is the deal he is hinting at?
5. CNBC — Oil prices today: WTI, Brent — Trump calls off Iran strike
6. Charles Schwab — Divided Fed Leaves Interest Rates Unchanged
7. CME Group — FedWatch Tool, September 2026 Rate Hike Probabilities
8. GoldSilver — Live Gold and Silver Spot Prices
9. Federal Reserve — FOMC Statement, July 29, 2026
10. FXEmpire — Gold Market Awaits Payrolls as Fed Rate-Hike Risk Stays Elevated
11. Bureau of Labor Statistics — The Employment Situation, June 2026
12. Silver Institute — World Silver Survey 2026
13. World Gold Council — Gold Demand Trends Q2 2026
Disclaimer: This article is for informational purposes only and does not constitute financial or investment advice. Always consult a qualified financial adviser before making investment decisions.
You May Also Like:
- Gold ETFs Lost 45 Tonnes Last Quarter. Central Banks Bought 289. Here’s What That Split Means.
- Gold Had Every Reason to Rally Today. It Didn’t. Five Reasons Why.
- Central Banks Bought 289 Tonnes of Gold Last Quarter. Prices Were Falling the Whole Time.
- PCE Drop and the Fed: Why the Market Reacted the Way It Did.
- Gold at $4,100. Silver Still Stuck Below $60. Five Signals Define the Next Six Weeks.
- Oil Spiked 8%. Gold Went Up Anyway. Here Is Why This Time Is Different.
The Edge Every Investor NeedsSmarter precious metals investing starts here. The Nuggets Newsletter brings you essential market insights, Fed updates, global trends, educational videos, and more.
Popular Topics
Picked from the archive
-
01
 Topics
Federal Reserve Pauses While Debt Soars: Gold Outlook
-
02
Topics
Why Silver Prices Are Up Today: Iran Deal Alters Fed Policy
-
03
Topics
Why Is the Gold Price Rebounding After a 9-Day Drop?
-
04
Topics
Gold and Oil Face Strait of Hormuz Deadline
-
05
Topics
Gold Near $4,330 as 70% Rate-Hike Odds Rise, China Intervenes
-
06
Topics
5 Drivers That Could Move Gold and Silver at Beijing Summit
-
07
Topics
Why Gold Failed to Rally Today: 5 Key Reasons
-
08
Topics
Gold Price Showdown: Will It Hit $5,000 or Drop to $3,500?