Central Banks Favor Gold Over the Dollar: Impact on Your Savings
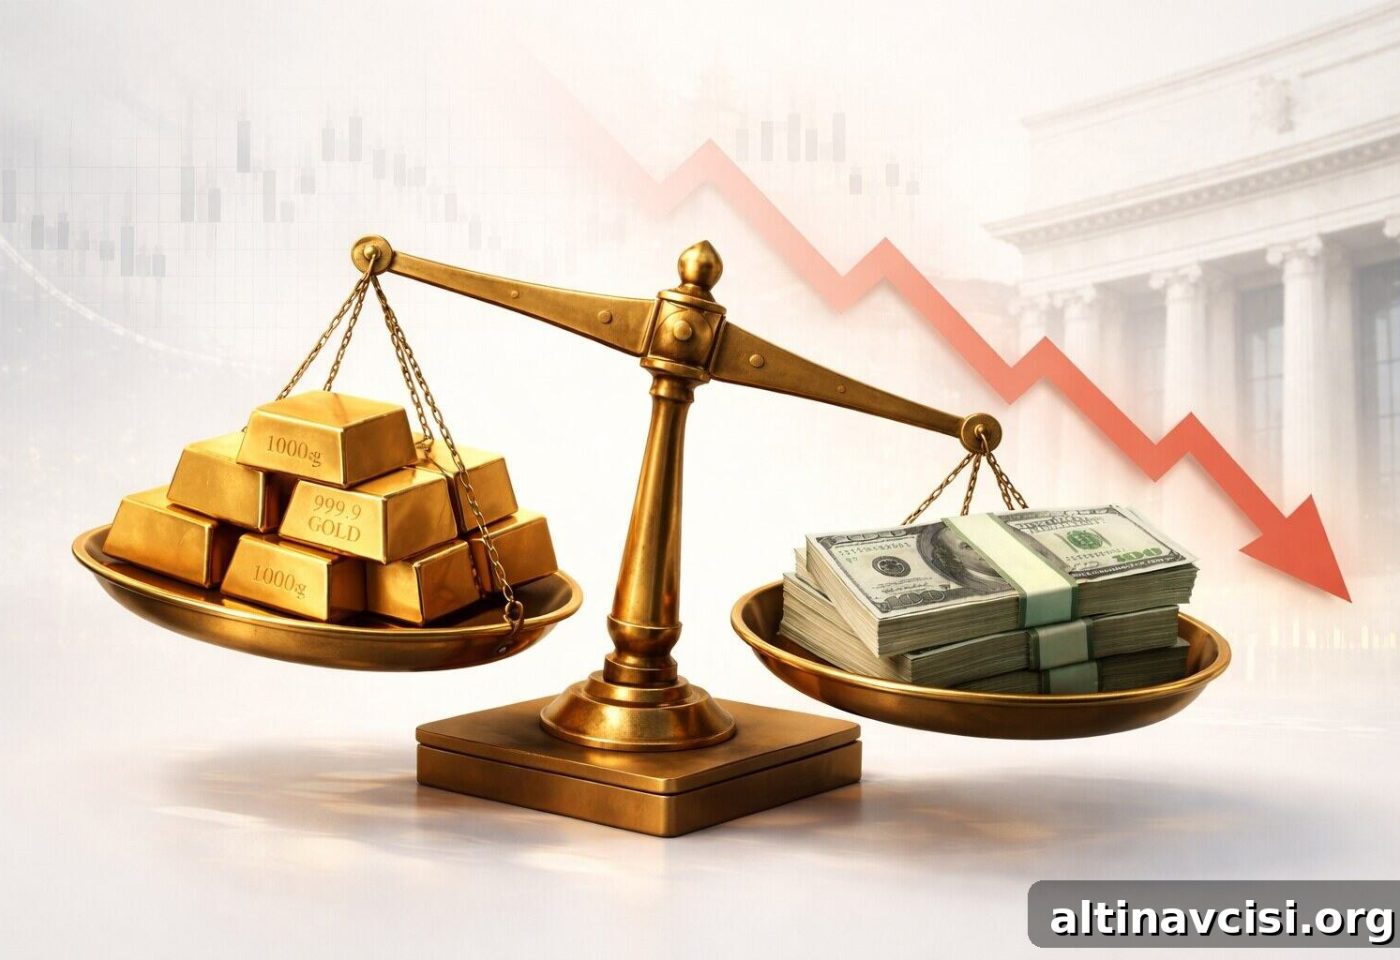
Bretton Woods collapsed in 1971. Since that moment, central banks worldwide have held more U.S. dollars than gold — until now. Recent reserve data show a meaningful shift in how sovereign institutions allocate their foreign assets.
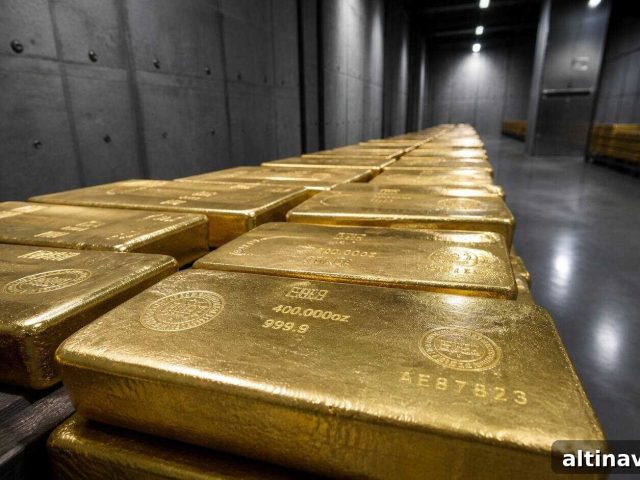
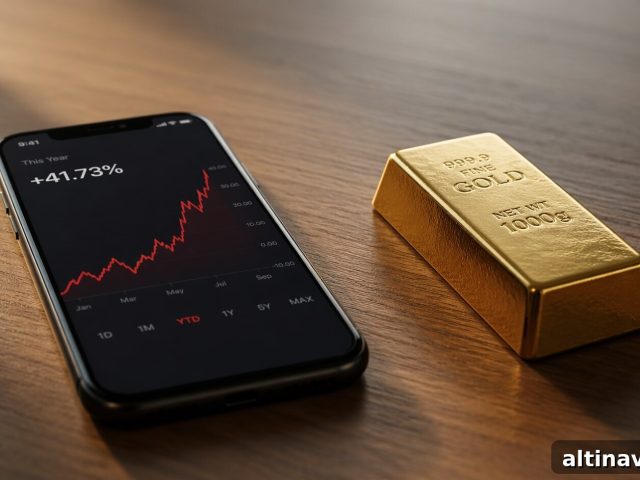
Official central bank gold reserves are now valued at approximately $3.87 trillion, edging past U.S. Dollar reserve assets, which stand near $3.73 trillion. This reversal of a nearly half-century trend coincided with a turbulent geopolitical week that included the start of the Strait of Hormuz blockade. In that same period, U.S.–Iran talks stalled and gold traded near $4,712 per ounce on April 14, 2025. Sovereign balance sheets are speaking through accumulation and repatriation; the question is whether individual savers are paying attention.
Why Are Central Banks Buying Gold Instead of Dollars?
The simple interpretation is this: the world’s most experienced money managers are increasingly hedging against fiat currency risk. This is not a short-term trading idea but a deliberate policy choice. Central banks are rebalancing their reserves toward physical gold to reduce exposure to dollar-denominated assets and to protect national purchasing power against potential currency debasement.
The headline number is stark. According to recent compilations of official data, central bank gold holdings reached a record $3.87 trillion, surpassing dollar reserve assets for the first time since the end of the Bretton Woods system. Since 2022, central banks’ gold reserves have roughly tripled in value, driven by both large-scale accumulation and rising bullion prices.
Three Transactions That Illustrate the Trend
- China has continued a long-running accumulation of gold, bringing its holdings to record values while reducing U.S. Treasury holdings — now at levels not seen since 2009.
- France quietly completed repatriation of roughly 180 tons of gold from the Federal Reserve Bank of New York back to Paris, finalizing domestic storage and realizing gains from higher prices. Total French reserves remain substantial and are now held entirely at home.
- Turkey carried out a substantial gold swap in late winter, temporarily converting 58–60 metric tons into cash to defend the lira. Most of the movement was a short-term liquidity operation rather than a permanent exit from gold.
The Turkish swap caused a sharp, brief correction — an 11% drop in gold during March, the fastest monthly decline since 2013 — but sovereign buyers quickly resumed purchases. The common pattern is clear: nations are systematically shifting reserves away from dollar assets and into physical precious metals. Major financial institutions have raised long-term gold targets in response; Goldman Sachs, ANZ, and UBS have published forecasts in the $5,400–$6,000 per ounce range, citing central bank demand as a structural driver rather than a temporary trend.
How Does the Strait of Hormuz Blockade Affect Gold Prices?
The shift toward gold has coincided with an acute geopolitical shock. After negotiations between the U.S. and Iran collapsed, a naval blockade of the Strait of Hormuz was announced. The strait is a critical chokepoint for global oil flows, and the announcement immediately tightened energy markets. Brent crude rose above $102 per barrel and WTI passed $104, while U.S. diesel prices climbed in response to the supply risk. Geopolitical risk tends to push investors into traditional safe havens like gold, strengthening demand even as other factors fluctuate.
What the Blockade Means for Oil and Energy Prices
The naval buildup and supply concerns translated into an immediate energy price shock. Higher crude prices and elevated logistics risk feed into inflationary pressures, which can bolster the narrative for owning gold as a hedge against inflation and supply-chain disruptions.
Why Federal Reserve Policy Creates Near-Term Headwinds for Gold
At the same time, a hawkish Federal Reserve has made the near-term outlook for gold more complex. Recent Fed minutes indicated that additional rate increases cannot be ruled out, pushing out expectations for rate cuts and supporting the U.S. dollar. A firmer dollar and higher Treasury yields — the 10-year yield climbed about 40 basis points in the last month — create a countervailing force that can temper gold’s short-term gains. What sets the current cycle apart is that institutional demand from central banks has been absorbing volatility that might previously have caused a sustained correction.
What to Watch This Week
Key data and events to monitor include the next Producer Price Index release, speeches from Federal Reserve officials, and major international gatherings such as the IMF and World Bank spring meetings, where Middle East stability will be on the agenda. Regional economic warnings from groups like ASEAN also matter for global risk sentiment.
What Individual Savers Should Consider
Silver traded near $74 per ounce in the recent session and has been more volatile than gold. Historically, silver often follows gold during monetary stress and can outperform on the upside due to industrial demand and tighter supplies. Major banks project silver averages in the $81–$90 range for 2026, with upside scenarios above $100 if supply deficits deepen because of renewable energy and electric vehicle demand. For savers who accept the broader sound-money thesis, silver can serve as an asymmetric complement to gold: higher volatility but potentially greater percentage gains.
The Mechanism Every Saver Should Understand
The rationale for precious metals is straightforward. When governments run persistent deficits and central banks expand money supply, fiat currencies can lose purchasing power over time. Gold and silver cannot be printed; their supply grows slowly and independently of monetary policy. For institutions managing national wealth, diversifying into assets outside the banking and bond system is an explicit defense against long-term currency risk — not a forecast of catastrophe, but a recognition of structural monetary dynamics.
Is This Shift Already Priced In?
Only partially. Gold prices have climbed substantially, but central bank accumulation shows signs of accelerating rather than peaking. Individual investors account for only a portion of the flows that have driven gold higher since 2022. The fact that gold reserves now exceed dollar reserves on a global basis is no longer speculative — it is a recorded reality — and sovereign balance sheets have been adjusting to that reality for several years.
SOURCES
1. The Kobeissi Letter — Central bank gold reserve data compilation
2. Vaulted — Gold Reserves vs. Treasuries analysis
3. Yahoo Finance — Coverage of gold surpassing U.S. Treasuries
4. World Gold Council — Central Bank Gold Reserves Survey 2025
5. TheStreet — Reporting on central bank gold movements
6. Business Today — Coverage of central bank buying trends in 2026
7. Global Times — Reporting on China’s reserve shifts
8. IDNFinancials — Reporting on China’s bond and gold moves
9. Mining.com — Coverage of France’s gold repatriation
10. Newsweek — Coverage of France’s gold repatriation
11. Numismatic News — Reports on France repatriating gold
12. GOLDINVEST — Coverage of France bringing gold back from New York
13. FXStreet — Coverage of Turkey’s gold sales to support the lira
14. ING Think — Analysis of Turkey’s central bank options
15. Canadian Mining Report — Reporting on Turkey’s rapid gold sales
16. TheStreet — Coverage of Goldman Sachs’ gold price targets
17. Finance Magnates — Coverage of Goldman Sachs’ gold forecast
18. Scottsdale Bullion & Coin — Summary of ANZ gold forecast
19. Scottsdale Bullion & Coin — Summary of UBS gold forecast
20. Investing.com — Factbox on major bank gold price forecasts
This article is for informational purposes only and does not constitute financial or investment advice. Always consult a qualified financial advisor before making investment decisions.
You May Also Like
- Hormuz Blockade Sent Gold Down 2%. Here’s Why That’s Bullish
- Gold Jumps 2% as Trump Plans Iran War Address Tonight
- $88 Billion a Month: Why U.S. Debt Is Driving Gold Prices
- CPI Hits 3.3%, GDP Stalls — Is Stagflation 2026 Here?
- War Risk, Stagflation Signals, and a $6,300 Gold Target
- Gold and Oil Brace for the Strait of Hormuz Deadline
- Iran War Deadline Puts Gold and Silver Prices on Edge
Popular Topics
Picked from the archive
-
01
 Topics
Gold, Silver Prices Hold Steady Ahead of Jackson Hole Summit
-
02
Topics
Gold Price to Hit $5,500 by Q1 2027? Central Bank Risk
-
03
Topics
Gold and Silver Rally After Venezuelan Shock Roils Markets
-
04
Topics
Inflation Under Trump: Fact Check on Price Changes
-
05
Topics
Key Indicator to Watch for Gold Ahead of Fed Decision
-
06
Topics
Trump Tours $2.5B Fed Renovation, Presses Powell on Rates
-
07
Topics
How the London Gold Fixing Shapes Global Gold Prices
-
08
Topics
Is Gold Overpriced or Undervalued? What 3 Models Reveal