Manufacturing Hits Four-Year High: Why Gold Stayed Flat
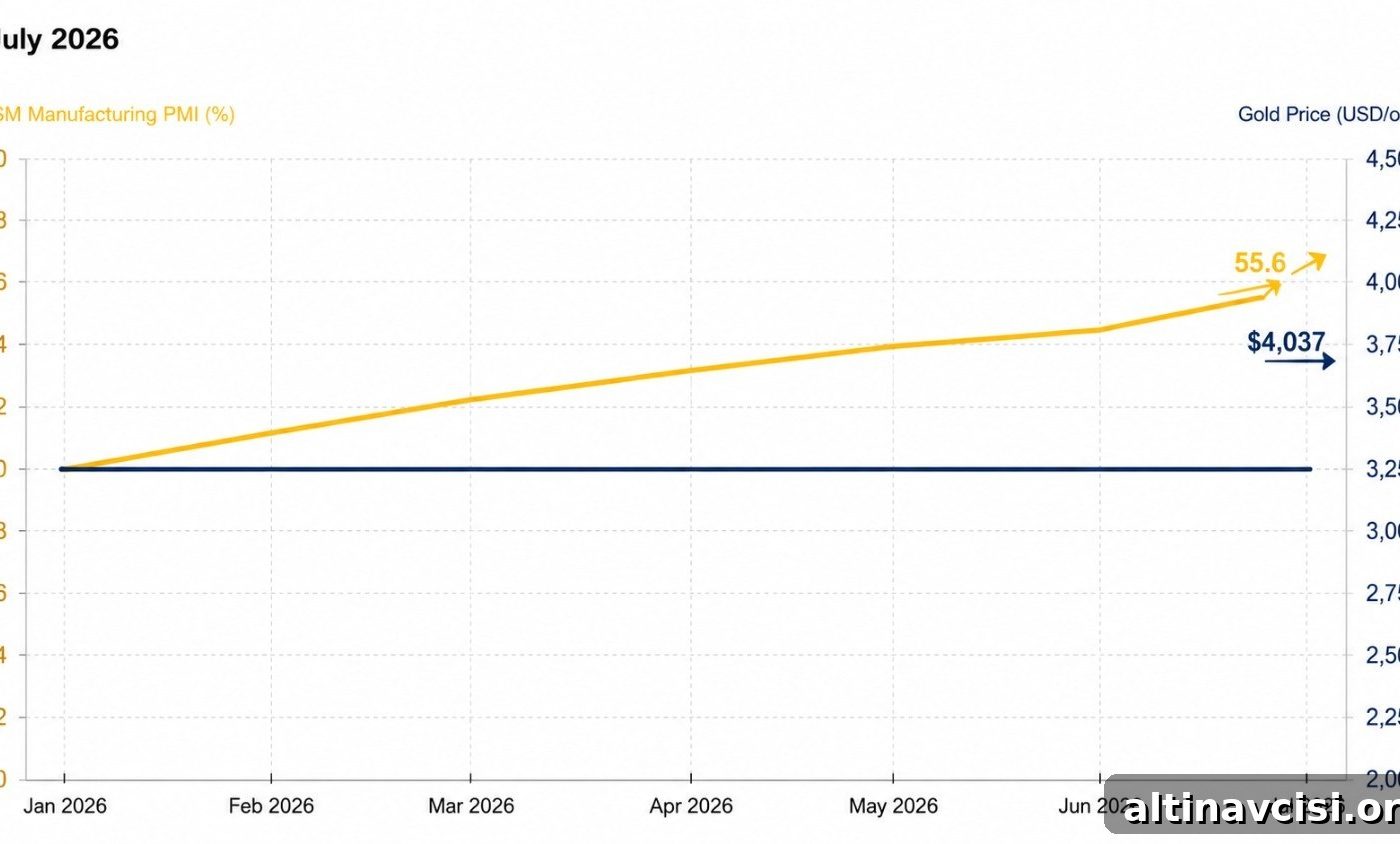
Gold is trading near $4,037 per ounce following the strongest U.S. manufacturing report in more than four years. The muted reaction from gold is not a failure to respond; it is a clear signal that the market is balanced between two opposing forces that nearly cancel each other out.
The Institute for Supply Management (ISM) reported the Manufacturing Purchasing Managers’ Index (PMI) at 55.6% for July 2026, above the 54.0% consensus and up 2.3 points from June’s 53.3%. That is the highest reading since May 2022. In most environments, a reading this strong would push gold lower. Today’s limited price movement shows the market absorbing two conflicting messages at once — one that supports tighter monetary policy and another that reinforces inflationary pressures that favor gold as a hedge.
Why Did Gold Barely Move After the Strongest Manufacturing Report in Four Years?
In short: the ISM report delivered two opposing signals simultaneously.
The first signal is hawkish. A 55.6 PMI indicates robust economic expansion and gives the Federal Reserve additional evidence that the economy can tolerate tighter policy. That strengthens the case for a September rate hike. Markets priced by the CME FedWatch Tool showed roughly a 65% probability of a September hike as of August 3, 2026, a factor that has been capping gold’s upside for several weeks. Non-yielding assets like gold become less attractive when rate-hike odds rise because the opportunity cost of holding them increases.
The second signal is inflationary. The ISM Prices Paid sub-index came in at 71.1%, slightly below June’s 73.0% but still above expectations of 70.3%. ISM respondent comments also highlighted pricing volatility, with 57% noting negative sentiment tied to price swings. In other words, manufacturers are still facing persistent input-cost pressures. That environment preserves the argument for holding physical gold as protection against purchasing-power erosion.
Because these two forces — stronger growth (hawkish) and continued input-price pressure (inflationary) — are pulling in opposite directions, gold has settled into an uneasy equilibrium that will need fresh information to break. That information comes through several key data releases this week.
What Does the ISM Employment Index Returning to Expansion Mean for the Fed?
A crucial but often overlooked detail in the ISM release was the Employment sub-index, which rose to 52.8% from June’s 49.7%, moving back into expansion territory for the first time in 33 months, according to ISM Chair Susan Spence.
That change is meaningful. For much of the past three years, manufacturing employment has been flat or contracting. That softness gave Fed officials who favored pausing rate hikes a labor-market reason to resist further tightening. Today’s reading weakens that argument by showing hiring in manufacturing has resumed.
At the July 29 FOMC meeting three regional Fed presidents — Beth Hammack (Cleveland), Neel Kashkari (Minneapolis), and Lorie Logan (Dallas) — dissented in favor of a 25-basis-point hike. The renewed strength in manufacturing employment and the ISM Production sub-index jumping to 58.5% from 52.2% supply the hawkish camp with the broadening-economy evidence they have sought. For gold, this matters because it increases the importance of incoming labor-market data and raises the odds that September will be consequential for policy.
What Should Gold Investors Watch This Week?
The economic calendar this week will function like a live referendum on the probability of a September Fed hike. Each release will either add to or subtract from the hawkish case:
- Tuesday — JOLTS (June job openings): A soft reading would weaken the rate-hike narrative and could lift gold modestly. A strong reading would reinforce the hawkish message already signaled by the ISM.
- Wednesday — ADP employment and ISM Services PMI: ADP provides a gauge of private hiring momentum, while ISM Services will show whether services inflation — which ran persistently above manufacturing inflation for much of 2026 — is easing.
- Friday — Nonfarm payrolls: The payrolls report is the week’s decisive data point. Before the July 29 FOMC meeting, markets had priced hike odds as high as 82%, then fell after the Fed chair’s press conference, and were around 65% by August 3. A strong payrolls print would push those odds higher and weigh on gold; a weak print could reverse the hawkish narrative and reopen the path toward $4,100 and beyond for bullion.
Beyond the rate-cycle debate, central-bank buying is a structural force that supports a baseline for gold prices. Central banks purchased 288.9 tonnes of gold in Q2 2026 — a record for a second quarter — even as prices were declining through that period. Sovereign buying during a price decline suggests a long-term, structural rationale rather than short-term tactical demand. That consistent central-bank demand sets a floor that is not undone by a single ISM print.
Finally, the Prices Paid reading at 71.1% is directly relevant to consumers. Manufacturing input costs typically flow into consumer inflation with a three- to six-month lag, meaning the July ISM inflation signal is already set to influence CPI readings this autumn. Sustained above-target inflation of the kind signaled by a high Prices Paid component is precisely the environment where a physical gold allocation can protect long-term purchasing power.
SOURCES
1. Institute for Supply Management — Manufacturing PMI® at 55.6%; July 2026 ISM® Manufacturing PMI® Report
2. Institute for Supply Management — Manufacturing PMI® at 53.3%; June 2026 ISM® Manufacturing PMI® Report
3. FXStreet — ISM Manufacturing PMI rises to 55.6 in July vs. 54 expected
4. CME Group — FedWatch Tool: September 2026 FOMC Meeting Rate Probability
5. World Gold Council — Gold Demand Trends Q2 2026
6. Federal Reserve — FOMC Statement, July 29, 2026
7. GoldSilver — Spot Price Charts, August 3, 2026
Disclaimer: This article is for informational purposes only and does not constitute financial or investment advice. Always consult a qualified financial adviser before making investment decisions.
You May Also Like:
- Gold Is Caught Between a Structural Bull Case and a Policy Ceiling. Something Has to Give by Thursday.
- The Same Force That Crushed Gold All Year Just Flipped
- Gold ETFs Lost 45 Tonnes Last Quarter. Central Banks Bought 289. Here’s What That Split Means.
- Gold Had Every Reason to Rally Today. It Didn’t. Five Reasons Why.
- Central Banks Bought 289 Tonnes of Gold Last Quarter. Prices Were Falling the Whole Time.
- Warsh Said the PCE Drop Was “Not Much” of a Consideration. Gold Agreed.
The Edge Every Investor Needs
Smarter precious metals investing starts here. The Nuggets Newsletter brings essential market insights, Fed updates, global trends, educational videos, and more.
Stay On Top of Gold & Silver Prices
Get important market alerts sent straight to your inbox.
Popular Topics
Picked from the archive
-
01
 Topics
Gold Remonetization: 6 Forces Reviving Gold as Money
-
02
Topics
CPI 3.3% and GDP Stalling: Is 2026 Stagflation Coming?
-
03
Topics
Why Is Gold Falling While War Rages?
-
04
Topics
Can Silver Outpace Gold in a Bull Market?
-
05
Topics
Gold Radar: 5 Hidden Signals Your Price Chart Misses
-
06
Topics
Gold Pullback Driven by Treasury Buyback, Not ETFs
-
07
Topics
Hong Kong Completes First Gold Settlement; Banks Also Run London
-
08
Topics
How a Falling Gold/Silver Ratio Impacts Investor Portfolios