How a Falling Gold/Silver Ratio Impacts Investor Portfolios
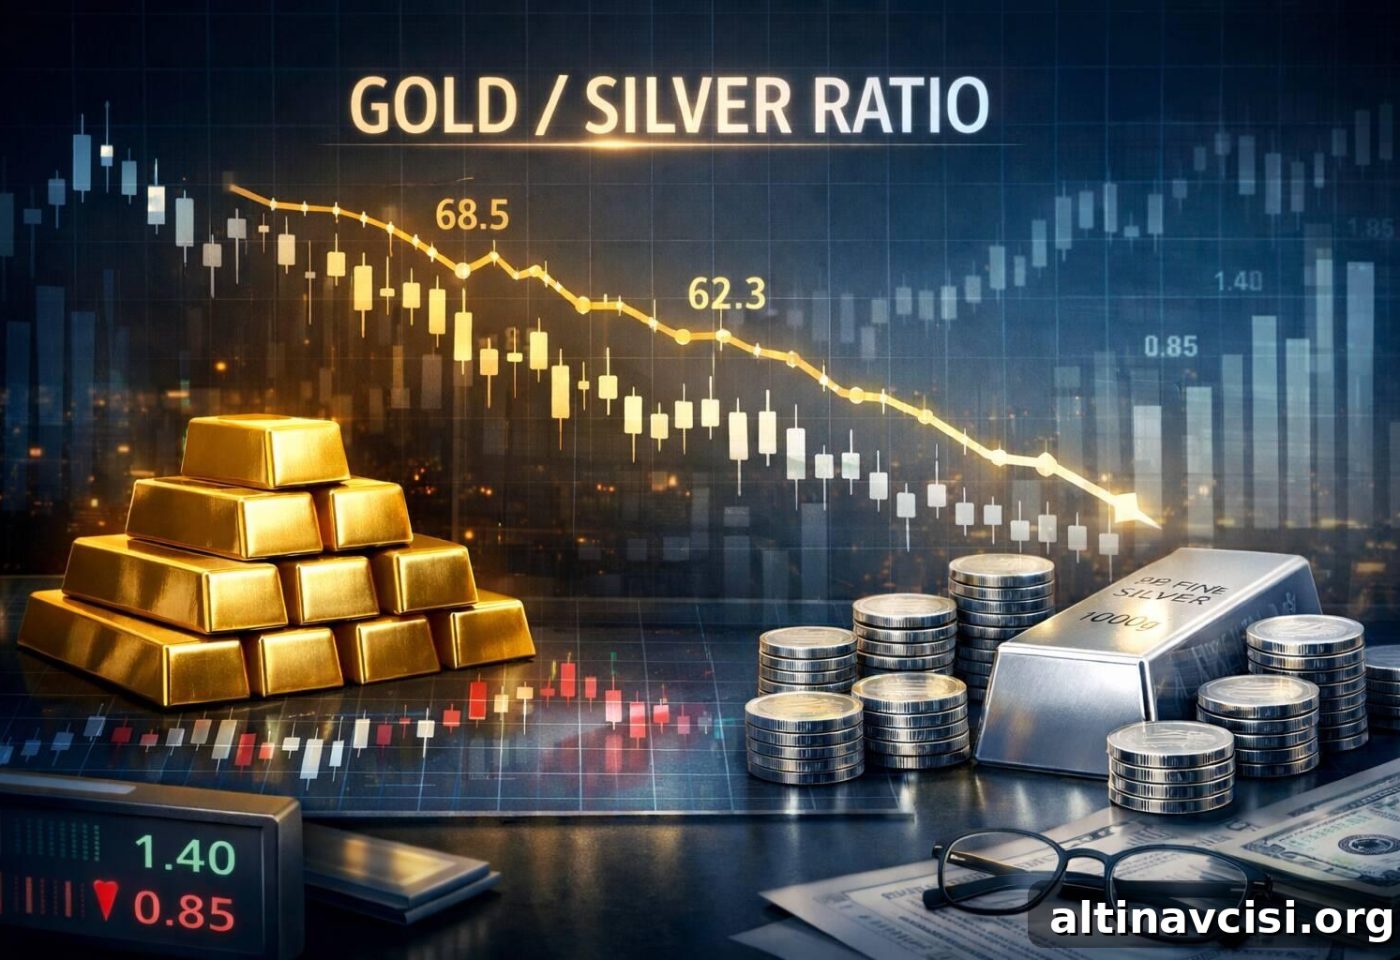
In April 2025, precious metals markets recorded a striking development: the gold-to-silver ratio briefly surpassed 100:1, meaning more than 100 ounces of silver were required to equal the value of one ounce of gold. At GoldSilver, we published an analysis explaining why this represented a historic extreme and why it presented a compelling buying opportunity for silver.
Nine months later, as we move into 2026, that ratio has narrowed to roughly 57:1. Gold posted an impressive 67% gain in 2025.
Silver, however, outpaced gold far more dramatically — jumping about 147% over the same period, more than doubling the returns of investors who acted when the ratio reached extreme levels.
This outcome was not merely luck. It was the result of applying historical pattern recognition to market relationships that have repeated for centuries.
The Gold-to-Silver Ratio: A Historical Perspective
For much of history, the gold-to-silver ratio was not left to open markets — it was set by governments and monetary authorities. Ancient civilizations established fixed ratios, ranging from about 15:1 in Rome to 12:1 in Byzantine times. The ratio stayed relatively stable through the Middle Ages, often hovering between 10:1 and 15:1.
In the United States, the Coinage Act of 1792 legally fixed the ratio at 15:1, effectively defining silver’s value relative to gold for currency purposes. That legal relationship produced a predictable exchange between the two metals — not because of supply and demand dynamics, but because authorities decreed it.
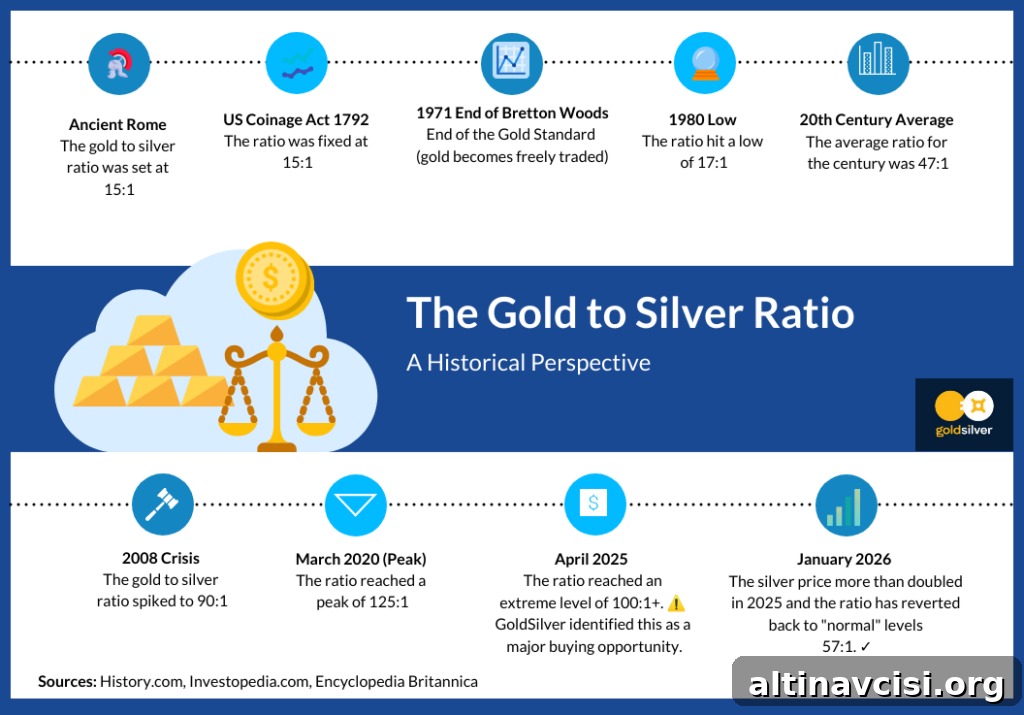
The modern era changed that. When nations left fixed exchange rates and abandoned metallic standards in the 20th century — culminating with the end of Bretton Woods in the 1970s — gold and silver began trading freely. Since then, the ratio has been set by the market and has shown substantial volatility compared with historical fixed rates.
Volatility Creates Opportunity
Freed from government control, the gold-to-silver ratio has swung widely. Instead of remaining near the historical 15:1 range, the modern ratio has reached extremes — from a low near 17:1 in 1980 to highs above 120:1 during market panics such as March 2020.
Decades of data show that these swings often follow a familiar pattern: when the ratio moves to an extreme — unusually high or unusually low — it often reverts toward its long-term average. That mean reversion tendency creates trading and allocation opportunities for investors who track the relationship.
During times of financial stress, investors typically flock to gold as the ultimate safe-haven asset, driving the ratio higher. Gold reached values near 90:1 during the 2008 financial crisis and climbed to roughly 125:1 during the COVID-19 market shock. Those extremes rarely endure. As risk sentiment stabilizes and industrial demand recovers, silver — which serves both industrial and monetary roles — frequently catches up with strong rallies.
Historical examples reinforce this dynamic. After peaking near 100:1 in the early 1990s, the ratio fell to around 40:1 by 1998 while silver significantly outperformed gold. After the 2008 spike to the 90:1 range, silver surged to near $50 per ounce by 2011, compressing the ratio back toward 30:1. These episodes illustrate how relative-value relationships can reverse dramatically when imbalances correct.
April 2025: Identifying the Extreme
When the gold-to-silver ratio moved above 100:1 in April 2025, it stood out as a significant statistical extreme. Only a few times in modern market history has the ratio exceeded that level — during recessionary periods in the early 1990s and most notably during the March 2020 panic.
Our analysis highlighted three core reasons the extreme was unlikely to persist and why silver offered asymmetric upside potential:
- Industrial demand for silver remained robust. The global shift toward renewable energy continued to drive silver consumption in solar panels, and growth in electric vehicles and electronics increased demand for silver’s superior electrical conductivity.
- Silver supply showed structural constraints. Much silver is produced as a byproduct of other metals mining, which limits how quickly primary silver supply can expand in response to price signals.
- The ratio was at a statistical outlier. At 100:1, the ratio stood multiple standard deviations above its long-term mean — a zone historically associated with correction and significant relative gains for silver.
Put simply: the relationship between the two metals had become unsustainably stretched, offering an attractive entry for investors willing to act on relative-value signals.
The Results: January 2026
As 2026 begins, market action has validated that assessment. The gold-to-silver ratio compressed from above 100:1 to roughly 57:1 — a move that reflects silver’s powerful outperformance.
Gold’s 67% gain in 2025 was exceptional, driven by continued central bank purchases, persistent inflationary forces, and heightened geopolitical uncertainty. Gold again fulfilled its role as a store of value when confidence in fiat assets waned.
Silver’s 147% rally tells a different story: investors who allocated to silver near the 100:1 extreme didn’t just keep pace with gold — they captured substantially larger returns. What felt uncomfortable when the ratio was at its peak proved highly profitable once the market corrected.
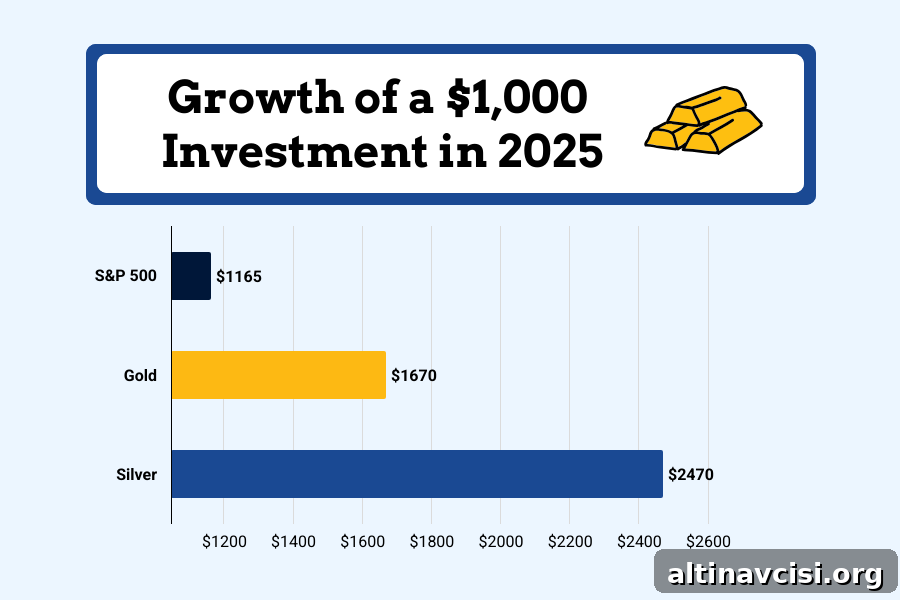
This type of outperformance is not random; it stems from identifying relative mispricing and maintaining the discipline to act when long-standing relationships deviate markedly from historical norms. While ratio analysis does not predict exact timing, it can highlight asymmetric risk-reward setups well before the broader market recognizes them.
What This Teaches Us About Market Timing
The 2025–2026 episode yields several lessons for precious metals investors:
- Statistical extremes matter. When asset relationships sit far outside their historical ranges, mean reversion becomes more likely. The difficulty is acting with conviction while market sentiment doubts the signal.
- The ratio is a practical valuation tool. It measures the relative pricing of two closely related assets; when one metal appears substantially cheaper than the other on a historical basis, that divergence can present an opportunistic trade or allocation adjustment.
- Patience is essential. The compression from 100:1 to 57:1 unfolded over months. Investors who bought at extremes often must wait through periods of continued elevation before the reversion occurs.
Understanding these patterns does not guarantee future success — markets can always surprise — but it does provide a disciplined framework for spotting opportunities when relationships between assets become distorted.
Looking Forward to 2026
At roughly 57:1, the gold-to-silver ratio now sits closer to its long-term average than it has in years. The extreme has corrected and much of the dramatic relative-opportunity that existed at 100:1 has been realized.
Yet the takeaway endures: the gold-to-silver ratio remains one of the most useful tools for precious metals investors. By studying its historical behavior and watching for statistical extremes, investors can better time allocations between gold and silver, manage risk, and identify asymmetric opportunities.
We will keep monitoring this ratio and publish analysis when new, significant distortions emerge. While the precise timing of the next extreme is unknowable, history suggests it is a matter of when — not if.
For investors who followed our April 2025 guidance, the results are clear. For others, the episode is a reminder that understanding relative value can be as important as forecasting absolute price moves in precious metals investing.

The Financial System Isn’t Safer — And You Know It
As risks mount, see why gold and silver are expected to remain central to portfolios in 2026 and beyond.
Subscribe to receive timely market updates, analysis, and alerts about gold and silver price movements.
Stay On Top of Gold & Silver Prices
Get important market alerts sent straight to your inbox.
Live price widget has been removed for this version. Check price charts from your preferred market data provider.
Sign up for concise market updates and expert commentary about gold and silver.
People Also Ask
What is the gold-to-silver ratio and why is it important?
The gold-to-silver ratio shows how many ounces of silver equal the value of one ounce of gold. It is a useful metric for investors who want to compare relative value between the two metals, identify potential buying opportunities, and decide how to allocate precious metals within a portfolio. Historical extremes in the ratio often precede periods of outperformance for the relatively undervalued metal.
Why is the gold-to-silver ratio falling right now?
The recent decline in the ratio is driven mainly by stronger silver performance. Renewable energy demand, especially solar PV production, and rising electronics and EV manufacturing have increased industrial consumption of silver. At the same time, silver’s constrained supply profile and improving economic expectations have supported silver prices relative to gold.
What factors influence the gold-to-silver ratio?
Several forces affect the ratio: industrial demand for silver, investor flows into both metals, mining supply conditions, broader economic growth or contraction, central bank policy, and currency moves. Gold tends to outperform during periods of severe uncertainty, while silver can outperform during economic recovery thanks to its industrial uses.
What does a falling gold-to-silver ratio mean for silver and gold prices?
A falling ratio generally indicates silver is outperforming gold — either because silver is rising faster or because gold is falling more slowly relative to silver. It often reflects rising industrial demand, improving economic sentiment, or a correction after an elevated ratio. For investors, a falling ratio can signal an opportunity to increase exposure to silver or rebalance holdings between the two metals.
How can investors use the gold-to-silver ratio to make informed decisions?
Investors use the ratio as a timing and allocation tool: buying silver when the ratio is historically high (often cited above 80:1) and considering rotation into gold when the ratio is historically low (often cited below 60:1). The ratio helps gauge relative value between two correlated assets and provides context for portfolio allocation based on historical norms and current market conditions.
- The 80/60 Gold-Silver Rule: A Smarter Way to Balance Your Portfolio
- Will Silver Hit Triple Digits in 2026?
- Gold/Silver Ratio Price Charts
- Gold-Silver Ratio: A Hidden Window into Inflation Trends
- The Silver Bird: An Antifragile Asset in a Weaponized Financial World.
Popular Topics
Picked from the archive
-
01
 Topics
World Gold Council: Gold Eyes $3,351 as Triangle Break Nears
-
02
Topics
Jobless Claims Drop, 4-Year High Raises Job Market Concern
-
03
Topics
Fed to Hold Interest Rates Despite Trump’s Calls for Cuts
-
04
Topics
Trump Imposes 35% Tariffs on Canadian Imports: Economic Impact
-
05
Topics
Dollar Steady as Markets Price 79% Odds of September Rate Cut
-
06
Topics
Gold Pauses at $3,357 After Rally as Bulls Target $3,500
-
07
Topics
When the Fed’s $2 Trillion Liquidity Buffer Reaches Zero
-
08
Topics
Gold Trading Volume: Why $227B Daily Trades Matter to Investors