Gold Price Drops 1.4% After Iran Strike – Key Number Tomorrow
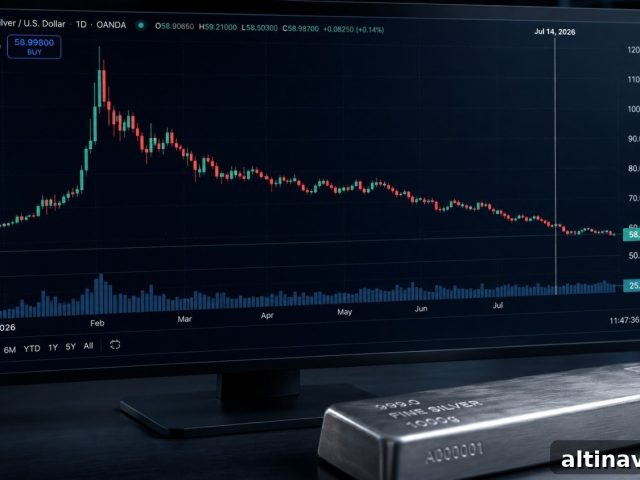
Gold is trading around $4,065 per ounce this morning, down roughly $55 (about 1.4%) on the day. Silver has fallen to about $58.49, off roughly 2.3%. Both metals weakened after US forces launched another round of strikes against Iran over the weekend following an Iranian attack on a Cyprus-flagged container ship. Tehran declared the Strait of Hormuz “closed until further notice,” a claim immediately dismissed by US Central Command.
At first glance, a geopolitical shock might seem like a reason for gold to rally. So why did it fall?
Why Does Gold Fall When Geopolitical Tension Rises?
Gold price
10-yr TIPS real yield
Indexed: Jan 1, 2026 = 100
Sources: Federal Reserve H.15 (10-yr TIPS) | goldsilver.com price charts | Data through July 13, 2026
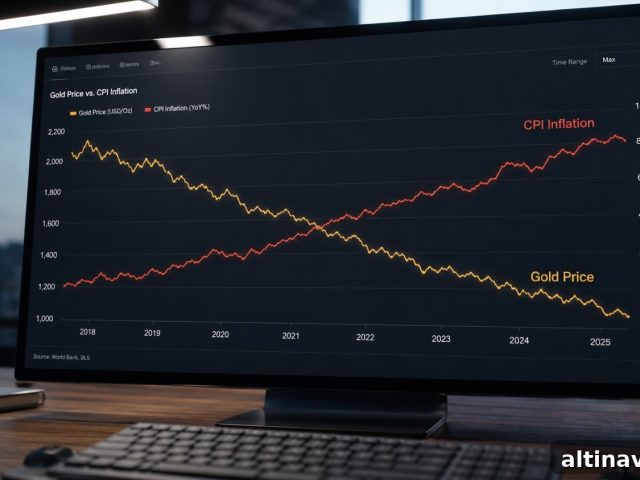
The short answer is real yields. Here’s how the chain works: when Iran strikes a vessel in the Strait of Hormuz, oil prices typically rise. Higher oil pushes headline inflation higher, which in turn raises expectations that the Federal Reserve will keep interest rates higher for longer or even raise them further. Gold, unlike bonds or money-market instruments, pays no yield. When real yields—the return on Treasury securities after adjusting for inflation—are positive and rising, the opportunity cost of holding gold increases. Traders sell gold to chase yield-bearing assets, and gold falls.
So the current Strait of Hormuz headline acts as a trigger. It raises the odds of higher energy prices, which lifts inflation expectations, which supports higher real yields—and that sequence weighs on gold.
The Edge Every Investor Needs
Smarter precious metals investing starts here. The Nuggets Newsletter delivers market insights, Fed updates, global trends, educational videos, and more.
What Does June CPI Have to Do With Gold?
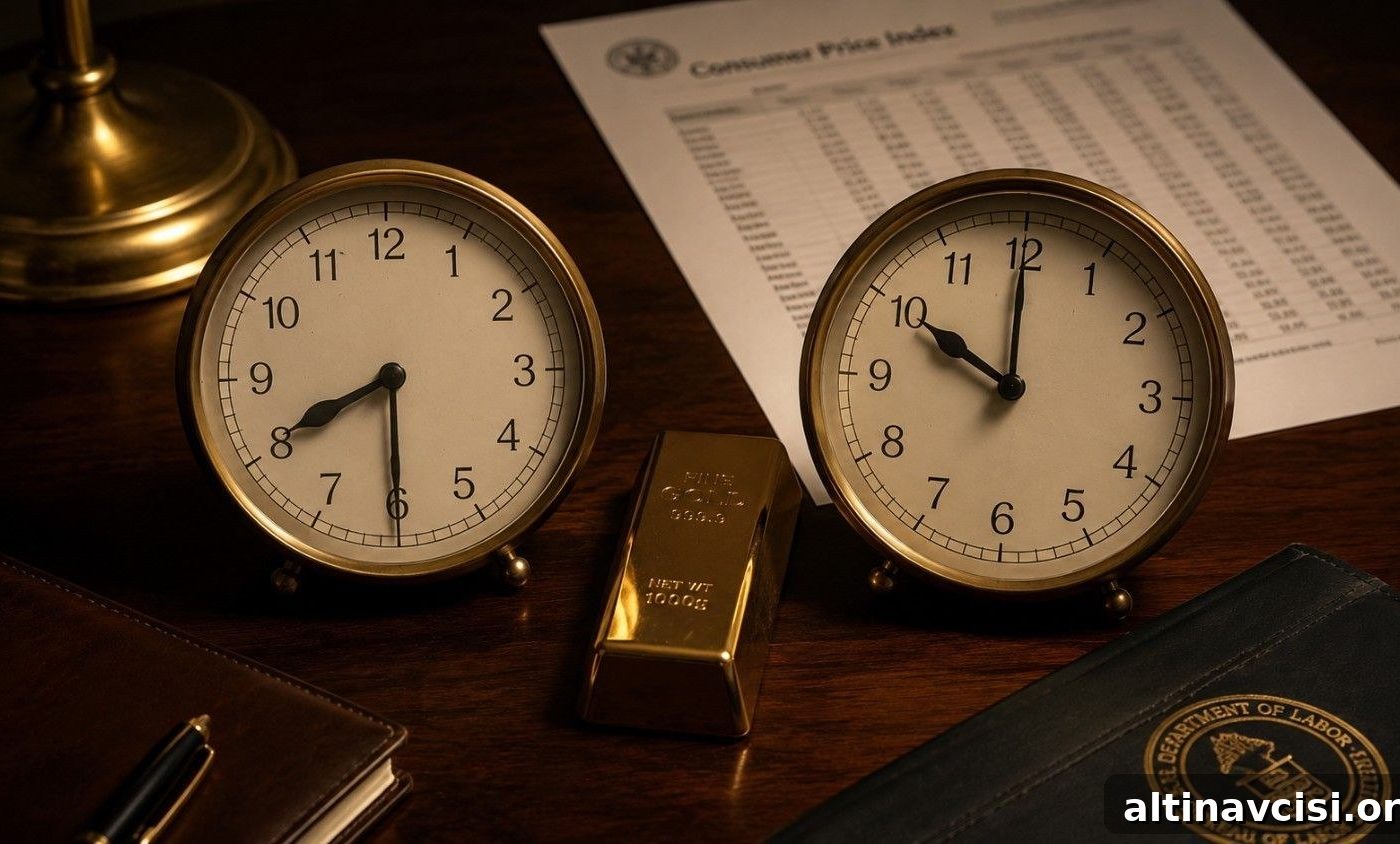
The Bureau of Labor Statistics is scheduled to release June inflation data on Tuesday, July 14, at 8:30 AM ET. That report matters for gold heading into the Federal Reserve’s July 28–29 meeting.
In May, CPI rose 4.2% year-over-year—its highest since April 2023—driven almost entirely by a 23.5% year-over-year rise in energy, which accounted for more than 60% of the monthly increase. That hot print prompted the Fed to raise its 2026 PCE inflation forecast and pushed market odds of a September rate hike significantly higher.
Since mid-June, however, oil prices have reversed. After a temporary reopening of the Strait of Hormuz and a ceasefire, crude fell roughly 20% from its 2026 highs and gasoline prices eased. That energy reversal raises the possibility that June’s headline CPI will print lower month-over-month—perhaps even negative—the first negative monthly headline reading since early in the pandemic.
Economists differ on exact figures, but several forecasts expect headline year-over-year CPI to soften in June. If the headline print comes in softer than expected, markets will likely lower rate-hike odds. Lower expected policy tightening reduces expected real yields, which lowers the opportunity cost of holding gold—allowing the metal to recover some losses.
What Are the Three Scenarios for Gold This Week?
Scenario 1 — CPI below consensus (headline monthly below −0.1%, core below +0.3%):
September hike odds fall, real yields compress, and gold could reclaim losses and test around $4,130. In this case the Iran headlines are treated as noise rather than a lasting trend.
Scenario 2 — CPI in line with consensus (headline about −0.1%, core about +0.3%):
Markets conclude energy-driven inflation has likely peaked. September hike odds remain elevated near recent levels. Gold stabilizes but does not significantly recover; attention shifts to Fed Chair Kevin Warsh’s testimony shortly after the data.
Scenario 3 — CPI above consensus (core above +0.3% or headline surprises positive):
Rate-hike expectations rise, the dollar strengthens, real yields increase further, and gold could extend losses toward the $4,000 level identified by some analysts as a structural floor.
What Will Warsh Say That Matters for Gold?
Fed Chair Kevin Warsh is set to testify before the House Financial Services Committee on Tuesday, July 14 at 10:00 AM ET—about ninety minutes after the CPI release—and before the Senate Banking Committee on Wednesday following the PPI report. This is his first congressional testimony since being confirmed in May 2026.
Markets will listen closely to two themes in his opening remarks. First, whether he frames any recent Iran-related energy spike as temporary or strictly geopolitical; if he treats the move as transitory, investors may lower rate expectations and that helps gold. Second, whether he emphasizes that inflation remains broadly elevated without acknowledging that May’s spike was largely energy-driven; such language would keep rate-hike odds higher and pressure gold.
Why Does the Structural Case for Gold Stay Intact Regardless?
Longer-term demand dynamics support the structural case for gold even when short-term rate dynamics push prices around. For example, China’s central bank added nearly 15 tonnes of gold in June 2026—the largest single-month purchase since October 2023—extending a buying streak by its reserve manager that has persisted for many months. Reserve managers operate on decades-long horizons, not daily news cycles.
China’s gold holdings still represent under 10% of its foreign exchange reserves, far below levels held by other major reserve managers. Separately, the Federal Reserve remains divided: the June Summary of Economic Projections showed roughly half of participants still expect at least one rate hike before year-end. A split committee and the reality of US debt servicing costs impose structural limits on how far real yields can rise.
Tomorrow’s CPI will move gold within a range, but it won’t alter gold’s core attributes: a non-yielding, outside-the-financial-system asset that cannot be diluted by monetary stimulus.
What Should You Watch Tomorrow Morning?
Two figures are sent at 8:30 AM ET on July 14. Watch them in order:
- Headline CPI month-over-month: A negative print would confirm the energy-driven reversal; a positive print suggests the recent flare-up is more persistent.
- Core CPI month-over-month (ex food and energy): The Fed focuses on this measure. At +0.3% month-over-month it is already elevated. A surprise above +0.3% would give the Fed political cover to signal a September hike; a print below +0.3% would be bullish for gold.
Warsh’s testimony follows at 10:00 AM ET. If CPI softens, watch whether his tone on energy-driven inflation becomes more permissive; the likely market sequence is data first, Fed reaction second.
For live market updates, consult your preferred real-time price provider for gold and silver quotes.
SOURCES
1. GoldSilver — Live Gold & Silver Price Charts, data through July 13, 2026.
2. Bureau of Labor Statistics — Consumer Price Index summary and scheduled releases (May and June 2026).
3. CME FedWatch Tool — market-implied rate-hike probabilities, July 2026.
4. Federal Reserve — Minutes and Summary of Economic Projections, June 2026.
5. State Administration of Foreign Exchange (SAFE), People’s Republic of China — official gold reserve updates, June 2026.
6. Bloomberg reporting on central bank gold purchases, July 2026.
7. World Gold Council — central bank gold reserves and mid-year valuation commentary, 2026.
8. US Treasury and Congressional budget data on federal debt and interest costs, 2026.
9. Selected market commentary and previews from financial outlets, July 2026.
Disclaimer: This article is for informational purposes only and does not constitute financial or investment advice. Always consult a qualified financial adviser before making investment decisions.
You May Also Like:
- Trump Declared the Ceasefire Over. Gold Barely Moved.
- HSBC Cut Its Gold Forecast by $304. Then Said Gold Will Hit $4,750 by Year-End.
- The Fed Named AI Its Top Inflation Risk. Gold Noticed.
- Five Days From Now, Two Numbers Will Decide Gold’s Second Half
- Bank of America Cut Its Gold Forecast. The Reason Is More Bullish Than It Looks.
- The Fed Is Split 9 to 8. Gold and Silver Are Paying the Price — Until July 14.
Popular Topics
Picked from the archive
-
01
 Topics
Gold Price Showdown: Will It Hit $5,000 or Drop to $3,500?
-
02
Topics
Wall Street’s $6,000 Gold Call Relies on Hidden Data
-
03
Topics
July 2026 Silver Outlook: Two Catalysts Set to Move Prices
-
04
Topics
Gold Prices Up 21%, Silver 25% YTD Amid AI and Inflation Fears
-
05
Topics
Gold Price Outlook June 2026: CPI Impact and Fed Signals
-
06
Topics
WGC Q1 2026: Asian Insights Wall Street Overlooks
-
07
Topics
Silver Jewelry vs Silver Bullion: A Buyer’s Guide
-
08
Topics
Why OCBC Cut Its Gold Forecast by $740