July 2026 Gold Price Outlook: Drop Leaves Bearish Case Intact
Key Takeaways
- As of July 13, 2026, gold traded near $4,038 per ounce, roughly 28% below its January all-time high of $5,595. Elevated US inflation and stronger Fed rate-hike expectations are the primary drivers of the recent decline.
- The World Gold Council’s Gold Valuation Framework estimates fair value near $4,100 per ounce with a ±5% tolerance band. Under the base case for H2 2026, consolidation is more likely than a collapse.
- The People’s Bank of China added 14.93 tonnes in June 2026—its 20th consecutive month of purchases and its largest single-month addition since 2023—buying into a period of historic quarterly decline.
- Major banks trimmed targets after the Fed’s hawkish pivot: Goldman Sachs lowered its year-end 2026 forecast to $4,900 and JPMorgan set a Q4 target near $4,500. Both scenarios remain above current prices and keep the structural bull case intact.
- The decisive near-term catalyst is the June CPI release on July 14; a soft print would reduce rate-hike odds and could open a path back toward $4,200–$4,300, while a hotter print would sustain pressure from rising real yields.
The gold outlook for July 2026 centers on a single tension: the price has retraced roughly 28% from its January peak as markets price a more hawkish Federal Reserve, yet the structural forces that supported the earlier rally—central bank buying, fiscal expansion, and reserve diversification—remain intact. Markets are now weighing timing versus direction: tactical pressure from rising real yields versus longer-term demand driven by sovereign buyers and global debt dynamics.
What Is the Gold Price Right Now, and Why Is It Here?
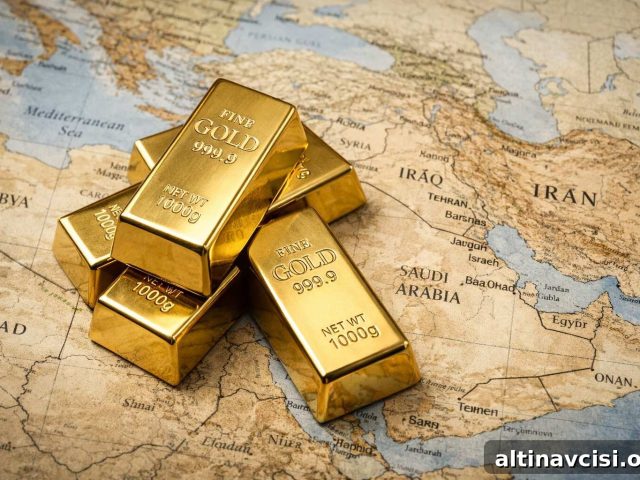
Gold traded around $4,038 per ounce on July 13, 2026, down about 1.4% on the day and around 28% from the intraday high of $5,595.47 reached on January 29, 2026. The correction is driven by a clear mechanism: gold is a non-yielding asset, so when interest rates and real yields rise, the opportunity cost of holding gold increases. In early 2026, geopolitical tensions in the Middle East pushed energy prices higher, which in turn lifted US inflation and raised the likelihood of further Fed tightening. That sequence—geopolitical shock to energy inflation to higher rate expectations to rising real yields—has been the central chain behind the recent price decline. The same chain can operate in reverse if inflation and rate expectations ease.
The Knowledge That Changes Everything
Two concise guides—free. Learn why gold matters and the risks of fiat currency systems.
How Did the Federal Reserve’s June Decision Affect the Gold Price Outlook?
At its June meeting the Federal Reserve held the policy range at 3.50%–3.75% in a unanimous vote. However, the dot plot showed division among participants: roughly half expected at least one hike before year-end while others projected no change or even a cut. Chair Kevin Warsh did not submit a dot, signaling uncertainty. Market pricing in early July put about a 20% chance of a July hike and roughly 60% odds of at least one hike by September. Those odds matter because a hike would push real yields higher and increase the cost of holding gold.
There is also a structural constraint that tempers how far and how fast rates can rise: US gross national debt stood near $39.39 trillion in early July 2026, and interest costs on outstanding marketable debt are already large. A central bank that tightens aggressively increases interest expense for the government, which creates a limit to the pace and duration of tightening. Over multi-year horizons this fiscal constraint is relevant to gold holders evaluating the structural backdrop.
What Does the World Gold Council’s Mid-Year Outlook Say About Gold Prices in H2 2026?
The World Gold Council’s Gold Mid-Year Outlook 2026 links gold’s fair value to real yields, inflation expectations, the US dollar, and central bank demand. Under a base-case macro path—which assumes one Fed hike before October and inflation peaking near the high 3% range—the model places fair value near $4,100 per ounce with a ±5% tolerance band, implying a second-half range of approximately $3,895–$4,305. The report frames the period as “Point Break”: tactical headwinds from rate expectations exist, while long-term structural supports remain intact. It cautions that declines beyond 10–15% historically draw countercyclical buyers, limiting downside in most scenarios.
Where Are Major Banks Setting Their Gold Price Targets for Year‑End 2026?
Institutional targets were revised lower after the Fed’s shift in tone. Goldman Sachs reduced its year-end target to $4,900 in June and noted a possible downside to $4,400 if the Fed hikes. JPMorgan trimmed its Q4 target to $4,500 and estimated a Q3 average near $4,300. Deutsche Bank expected Q3 averages around $4,300 and Q4 near $4,800. State Street’s monitor offered scenarios with a baseline between $4,750–$5,500 within six to nine months and a lower-case band of $4,000–$4,750. Across major institutions the range centers roughly between $4,400 and $5,500, with the Fed’s path as the primary variable.
Why Are Central Banks Still Buying Gold Despite the Price Correction?
Central bank purchases are the defining structural feature of the gold market today and continued through the correction. In June 2026 the People’s Bank of China added 14.93 tonnes—their 20th straight month of buying and the largest single-month addition since October 2023—buying into a quarter that was otherwise weak for prices. China’s holdings remain a smaller share of its total reserves compared with the global average, which helps explain the extended buying program: reserve managers aiming to rebalance allocations can sustain purchases over long horizons.
Globally, central banks have averaged substantial net purchases in recent years, absorbing a material share of annual mine supply and providing a persistent structural bid. For long-term price support, central bank mandates and reserve diversification policies matter more than short-term ETF flows or daily volatility.
What Is the Key Risk That Could Push Gold Lower in July 2026?
The primary near-term risk is a hotter-than-expected June CPI print on July 14. May CPI ran near 4.2% year-over-year, driven largely by energy; a June reading that surprises to the upside—especially if core inflation stays sticky—would raise September rate-hike odds and further pressure gold. A surprise Fed hike at the July 28–29 meeting, currently viewed as a low-probability event, would also be a meaningful downside shock. Paradoxically, in this cycle a worsening US–Iran conflict that pushes oil higher can be negative for gold because it tends to lift inflation expectations and thus real-yield prospects.
What Could Push Gold Back Above $4,500 in H2 2026?
Three catalysts could reverse the recent trend and support a move above $4,500: a soft June CPI print that reduces rate-hike odds; a notable deterioration in the US labor market that undermines the Fed’s tightening case; and a reversal of ETF outflows combined with persistent central bank buying. Institutional inflows plus ongoing sovereign demand would create a strong bid and could drive prices substantially higher if these factors align.
What Is the Sound‑Money Investor’s Perspective on This Correction?
Measured from the January peak, a 28% pullback looks significant. Measured over a multi‑year horizon it looks different: from January 2020 at roughly $1,560 per ounce to July 2026 near $4,040, gold has gained approximately 160% even after the correction. The core structural drivers—rising sovereign debt burdens, long periods of negative real rates, and active reserve diversification by many central banks—remain in place. For long-term holders focused on financial sovereignty, the correction is primarily a change in entry price rather than a reversal of the investment thesis.
Stay On Top of Gold & Silver Prices
Receive important market alerts directly to your inbox.
People Also Ask
What is gold’s price forecast for the rest of 2026?
Institutional forecasts vary: a low‑case around $4,400 and a high around $5,500 reflect differing assumptions about inflation, the Fed’s path, and demand. Goldman Sachs’ base case in mid-2026 was $4,900, JPMorgan’s Q4 target was $4,500, and other institutions presented scenarios centered roughly between $4,300 and $5,000. The World Gold Council’s framework implied rangebound trading around $4,100 ±5% under a neutral macro scenario.
Why did gold fall so much in 2026?
Gold fell primarily because geopolitical tensions raised energy prices, which lifted US inflation and increased expectations for Fed hikes. Higher expected policy rates and rising real yields raise the opportunity cost of holding non‑yielding assets like gold, which explains the bulk of the decline.
Is now a good time to buy gold in July 2026?
That depends on the investor’s horizon and objectives. At roughly $4,040, gold sits below the World Gold Council’s fair‑value midpoint and well below its January peak. For long-term investors focused on reserve diversification or wealth preservation, structural drivers remain intact and the correction may present a buying opportunity. Short‑term traders should monitor the June CPI print and the July FOMC meeting for clearer tactical guidance.
How does the Fed’s rate decision affect gold prices?
Fed policy influences gold mainly through real yields: if the Fed tightens and real yields rise, gold typically comes under pressure; if the Fed eases or signals fewer hikes than expected, real yields tend to fall and gold often benefits. Real yields, rather than nominal rates alone, are the key link.
What does central bank buying mean for prices?
Sovereign purchases create a structural floor because central banks buy on multi‑year mandates rather than reacting to daily price moves. With several central banks actively increasing allocations, this demand absorbs a meaningful portion of annual supply and limits downside in prolonged corrective phases.
What Should Gold Investors Watch in July and August 2026?
Four dates matter most in the near term:
- July 14 — June CPI (8:30 a.m. ET): The single most important near-term catalyst. A softer print would reduce rate-hike odds and help stabilize gold; a hotter print would keep pressure on prices.
- July 14 — Chair Warsh’s Congressional Testimony: Watch language for any sign of change in the Fed’s risk assessment; softer rhetoric would be supportive for gold.
- July 28–29 — FOMC Meeting: A hold is the base case; any surprise hike or markedly hawkish guidance would be negative for gold.
- August 2026 — PBOC Reserve Data: Continued Chinese purchases would reinforce the structural support provided by central banks.
In short, the gold price sits at a decision point: short-term data on inflation and Fed policy is actively competing with long-term sovereign demand trends. The structural case for holding physical metal remains unchanged, while the tactical picture should clarify as CPI and Fed decisions unfold.
SOURCES
1. GoldSilver — Live Gold Spot Price
2. World Gold Council — Gold Mid-Year Outlook 2026: Point Break, July 1, 2026
3. World Gold Council — Central Bank Gold Reserves Survey 2026
4. Federal Reserve — FOMC Minutes, June 16–17 Meeting, released July 8, 2026
5. CME Group — FedWatch Tool, July 2026
6. U.S. Treasury — Fiscal Data (debt figures), July 6, 2026
7. Bureau of Labor Statistics — Consumer Price Index Summary, May 2026
8. Bloomberg — China’s PBOC Buys Most Gold Since 2023, July 7, 2026
9. South China Morning Post — China Extends Gold‑Buying Binge to 20th Month, July 7, 2026
10. European Central Bank — The International Role of the Euro, June 2, 2026
11. J.P. Morgan Global Research — Gold Price Outlook 2026
12. State Street Global Advisors — July 2026 Monthly Gold Monitor
Disclaimer: This article is for informational purposes only and does not constitute financial or investment advice. Consult a qualified financial advisor before making investment decisions.
You May Also Like:
- Buying the Top: A Survival Guide for Gold and Silver Investors
- How Do Gold Price Cycles Work? A Framework Across Four Time Horizons
- The $300 Billion Lesson: What Frozen Reserves Taught Central Banks About Gold
- How To Perform Silver Technical Analysis (in 5 Steps)
- Who Controls the Gold Market? Meet the Five Banks That Settle Every Ounce
- How the Jobs Report Moves Gold and Silver: The Five-Step Chain Behind Every Move
- What Is Profit Booking in Gold and Silver? The Mechanism Explained
Popular Topics
Picked from the archive
-
01
 Topics
Selling Gold? How the 28% Collectibles Tax Rule Works
-
02
Topics
Gold Volatility Index (GVZ): What It Means for Investors
-
03
Topics
Silver Price Forecast 2026-2027: Bull vs Bear Outlook
-
04
Topics
Gold Hits $4,000: Wake-Up Call for Markets and Policymakers
-
05
Topics
Gold Safe-Haven Demand Returns After 9-Day Selloff
-
06
Topics
Gold, Silver Rally as Federal Reserve Independence Is Questioned
-
07
Topics
PCE Hits 3.8%, GDP 1.6%: What Drove Gold Higher
-
08
Topics
Why Gold Prices Are Holding at $5,000 Today