Fed 9-8 Split Drives Gold, Silver Prices Down Through July 14
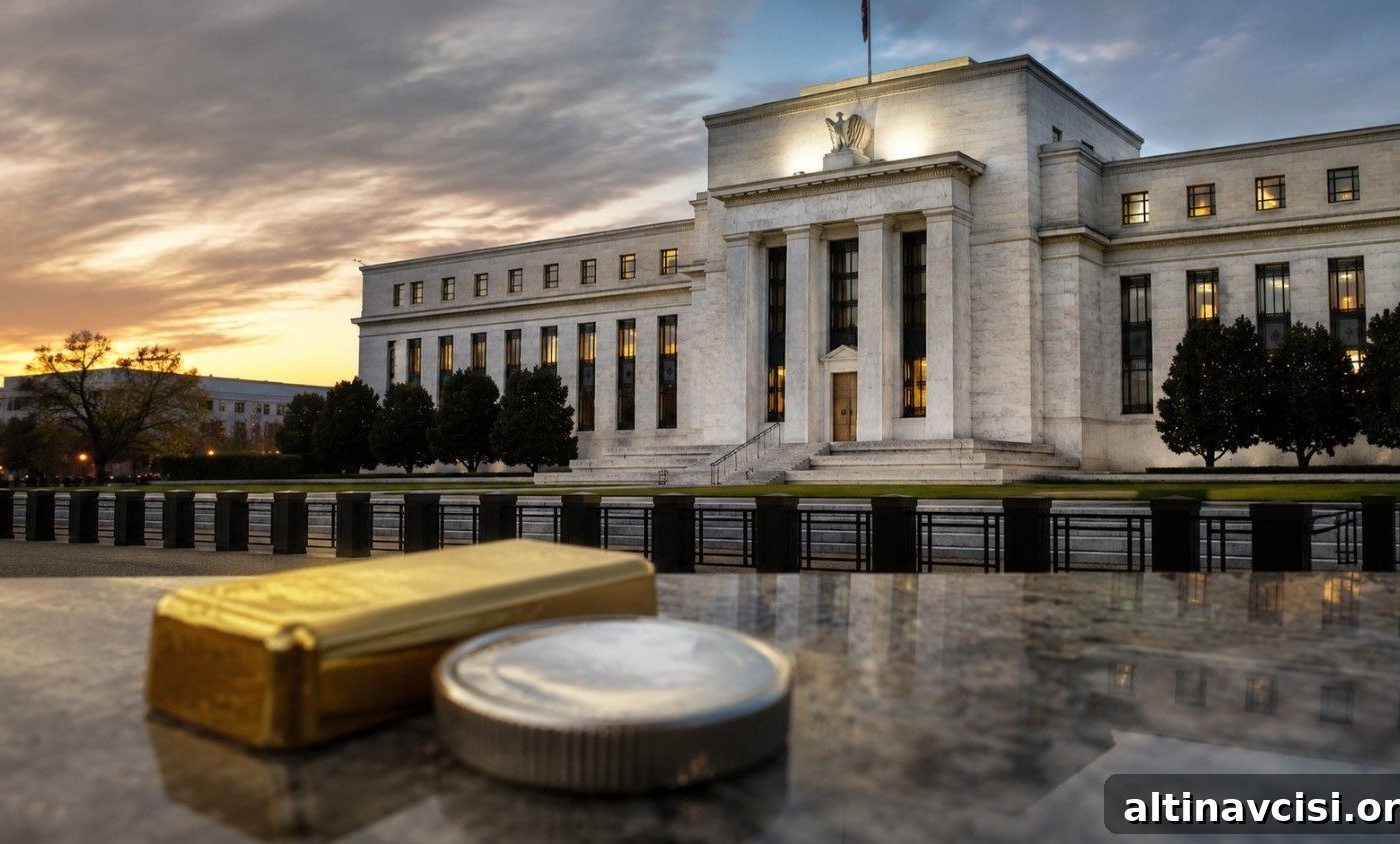
The Federal Reserve published the minutes from Chair Kevin Warsh’s first meeting on July 8, 2026, at 2:00 p.m. ET. By late afternoon that day, gold was trading around $4,075, down roughly 0.75%. Silver fell to about $58.27, a decline of 2.83%. Both metals remain well into correction territory: gold sits about 27% below its January record high of $5,589, while silver is roughly 52% below its January peak of $121.64.
Although the minutes were not the sole cause of the price moves, they clarified the policy mechanics that have pushed metals lower this year. They also highlighted the single data point that could determine whether that pressure persists or eases.
What Did the FOMC Minutes Show?
At the June 16–17 meeting, the Committee unanimously kept the federal funds rate target at 3.50%–3.75%. The decision itself was expected. What mattered more was the committee’s rationale and projected path for rates.
Of the eighteen participants who submitted projections, nine expected at least one rate hike before the end of the year, eight expected no change, and one expected a cut. Notably, Chair Warsh did not submit a projection — the first Fed chair to withhold a dot-plot estimate since that chart was added to the Summary of Economic Projections in January 2012.
Three specific takeaways from the minutes are particularly relevant for precious metals:
- The Fed has dropped language that previously implied an easing bias, signaling it no longer wants to suggest rate cuts are imminent.
- Most participants who flagged upside inflation risk indicated that additional policy firming would likely be appropriate if inflation remains elevated — a near-consensus view rather than a vague acknowledgment of upside risks.
- A majority of participants expressed concern that persistent higher inflation could begin to affect inflation expectations, a worry that has not been prominently voiced since 2022. At the same time, staff revised core PCE upward by 0.6 percentage points in a single quarter — from 2.7% in March to 3.3% — while lowering GDP growth projections. The Fed’s own model now shows slower growth with stickier inflation.
The Edge Every Investor Needs
Smarter precious metals investing starts with timely insight. The Nuggets Newsletter delivers market context, Fed developments, and practical analysis for gold and silver investors.
Why Did Gold and Silver Fall After the Minutes?
The minutes coincided with a separate geopolitical shock. On July 8, President Trump declared the Iran ceasefire “over” at the NATO summit in Ankara, airstrikes on Iran resumed, and oil prices jumped more than 5%. Those developments fed the transmission mechanism that has pressured precious metals throughout 2026: a spike in oil raises inflation expectations, which increases the likelihood of Fed rate hikes, lifting real Treasury yields and weighing on gold and silver.
The World Gold Council’s mid-year valuation framework estimates gold’s fair value at roughly $4,100, plus or minus 5%, based on a scenario that includes one Fed hike by October 2026 and inflation peaking near 3.9%. At the prevailing price near $4,075, gold is within that valuation band and close to the midpoint — not decisively broken.
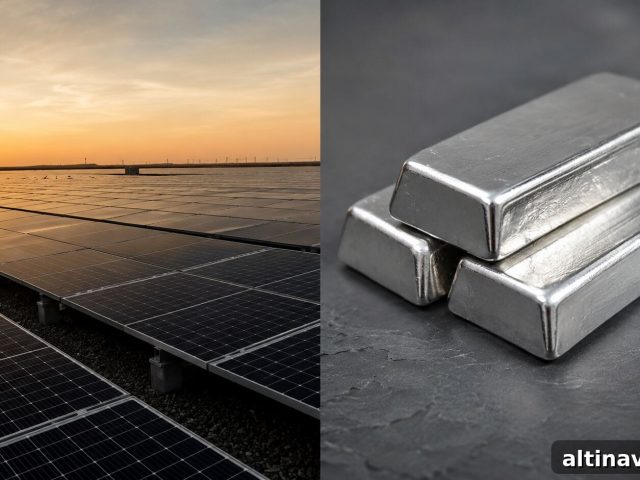
Silver was hit harder because its demand is split between industrial use and monetary investment. Approximately 58% of annual silver demand is industrial (solar panels, semiconductors, EV components), according to the Silver Institute’s World Silver Survey 2026. A hawkish Fed outlook that slows growth directly suppresses industrial demand, while the remaining 42% of silver demand reacts to real yields in a way similar to gold. On July 8 both demand drivers were pressured, and the gold-to-silver ratio moved near 70 — well above the roughly 60 historical average across five decades. That elevated ratio signals relative undervaluation of silver compared with gold, rather than a fundamental structural breakdown.
What Does July 14 Decide for Gold and Silver?
June CPI will be released on Tuesday, July 14, at 8:30 a.m. ET. May’s year-over-year CPI reading was 4.2% — the figure that helped prompt the hawkish dot-plot shift in June. If June’s CPI prints at or above 4.0% again, the market’s odds of a September rate hike rise toward 65%, real yields would likely stay elevated, and downward pressure on gold and silver would probably persist. If June’s CPI falls below about 3.8%, the market mechanism could reverse: expectations for hikes would ease, real yields would fall, and both metals would have room to recover. Under that scenario, J.P. Morgan’s Q4 2026 gold target of $4,500 becomes more attainable and the gold-to-silver ratio near 70 would likely begin to compress.
One longer-term factor that remains unchanged regardless of short-term data: the People’s Bank of China reported adding 14.93 tonnes of gold to its reserves in June 2026, its largest single-month purchase since October 2023 and the twentieth consecutive month of reported purchases. That is a strategic reserve decision on a multi-year horizon and is independent of the Fed minutes or weekly price swings.
In short, the FOMC minutes confirmed a near-term headwind for precious metals but did not overturn the longer-term case for demand. The CPI release on July 14 is the next market-moving number to watch.
SOURCES
1. Federal Reserve — Minutes of the Federal Open Market Committee, June 16–17, 2026
2. Federal Reserve — Summary of Economic Projections, June 2026
3. Bureau of Labor Statistics — Consumer Price Index Summary, May 2026 (June 10, 2026)
4. Bureau of Labor Statistics — Employment Situation Summary, June 2026 (July 2, 2026)
5. CME Group — FedWatch Tool, September 2026 Rate Hike Probabilities, July 9, 2026
6. World Gold Council — Gold Mid-Year Outlook 2026: Point Break (July 1, 2026)
7. Silver Institute — World Silver Survey 2026: Supply and Demand Data
8. GoldSilver — Live Gold and Silver Spot Prices, July 9, 2026
9. Commerzbank via FXStreet — PBoC June 2026 Purchase Data (July 7, 2026)
10. TD Economics — U.S. FOMC Meeting June 16–17, 2026: Analysis and Key Takeaways
Disclaimer: This article is for informational purposes only and does not constitute financial or investment advice. Always consult a qualified financial adviser before making investment decisions.
You May Also Like:
- Gold Is Sitting on $4,000. The World Gold Council Has a Model for What Happens Next.
- Trump Called the Deal Dead. Oil Jumped 6%. Gold Fell. Here Is Why Both Moves Make Perfect Sense.
- China Just Bought Its Most Gold Since 2023. It Did It During the Quarter Gold Fell 16%.
- Iran Struck the Mediator’s Tanker. Gold Fell. The Funeral Ends Thursday.
- BofA Says the Stock Market Is About to Snap Back. Gold Is Down 3% This Year. Do the Math.
- Warsh Sat Out the Dot Plot. The FOMC Minutes Drop Wednesday.
Popular Topics
Picked from the archive
-
01
 Topics
World Bank Predicts Precious Metals Prices to Rise 42% This Year
-
02
Topics
Gold Price Forecast: Oil Futures Diverge From Stocks
-
03
Topics
Gold Weekly: $9T Swing, Trump Fed Nominee, Record Premiums
-
04
Topics
How Stagflation Sparks Both Drivers of Silver
-
05
Topics
What’s Driving Gold Demand from Washington, D.C. to Mumbai
-
06
Topics
Dollar Steady as Markets Price 79% Odds of September Rate Cut
-
07
Topics
Gold Price Tops $5,500 Amid Accelerating Metals Rally
-
08
Topics
Central Banks Favor Gold Over the Dollar: Impact on Your Savings