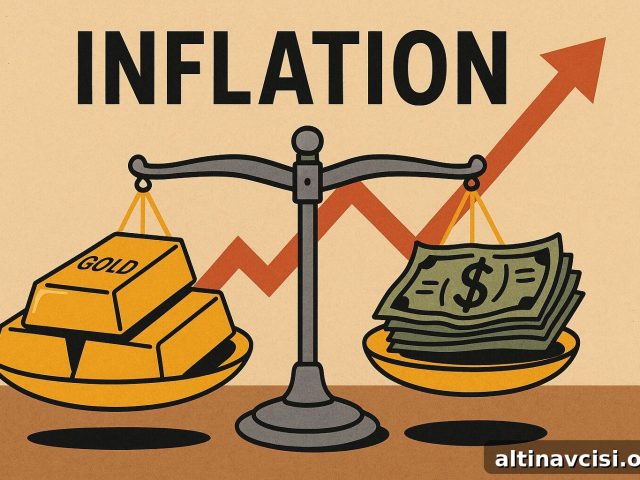
Dow-to-Gold Ratio: 100-Year Market Trend Analysis

The Dow‑to‑gold ratio divides the Dow Jones Industrial Average by the price of one ounce of gold. It tells you roughly how many ounces of gold equal one unit of the Dow index. Today that number sits near 10 — well below its 50‑year average of about 15 and far under the peak reading near 43 at the dot‑com bubble in 1999. That compression reflects a gold bull market that is already in motion: in real terms gold has outpaced stocks, and the structural drivers behind that outperformance — monetary weakening, persistent inflation, and strong central bank demand for bullion — remain active.
Since January 1, 2026, gold has risen roughly 15.6% while the Dow has gained about 2.7% over the same period [StatMuse]. The Dow‑to‑gold ratio captures that divergence precisely: with the Dow near 47,917 and gold trading near $4,780 per ounce, the ratio is about 10. That means it takes roughly ten ounces of gold to equal one unit of the Dow index. At the dot‑com peak in 1999 the ratio reached roughly 43. That long shift holds lessons about relative value between equities and hard money — and it helps frame where the cycle may go next.
What Is the Dow‑to‑Gold Ratio?
The Dow‑to‑gold ratio is simply the Dow Jones Industrial Average divided by the spot price of a troy ounce of gold. It is a relative valuation measure, not a short‑term price forecast. A high ratio indicates that stocks are expensive in gold terms — it takes many ounces of gold to match one unit of the Dow. A low ratio shows that gold has risen relative to equities — fewer ounces equal the same index value. Over more than a century this ratio has acted as a long‑run thermometer of the monetary environment, with extended periods above or below its mean eventually resolving toward historical averages.
Why Has the Dow‑to‑Gold Ratio Marked Major Market Turns?
Historically, extreme ratio readings have coincided with major monetary and market turning points. In 1929 the ratio peaked near 19 as speculative mania gripped stocks; by 1933 the Dow collapse pushed the ratio down toward about 1.94 while gold held. In 1966 a different peak sent the ratio toward the high 20s, and the stagflation era that followed put severe pressure on equities while boosting gold’s purchasing power.
The credit expansion of the 1980s and 1990s pushed the ratio to an all‑time high around 43 in 1999, when gold traded in the low $200s per ounce. The dot‑com bust and the following decade saw gold surge while equities lagged, compressing the ratio to a cycle low near 6.7 by 2011. The long‑run average since gold began trading freely after 1971 sits near 15; peaks above that level have often preceded multi‑year gold bull markets, while troughs have eventually given way to equity recoveries. The ratio’s history doesn’t time precise turns, but it reliably signals broad shifts in relative value.
What Does a Ratio of 10 Mean Today?
A ratio around 10 is confirmation that the current gold bull market is well advanced. Gold reached an all‑time intraday high of $5,589.38 on January 28, 2026 before settling back to roughly $4,780 as of early April 2026, while the Dow has broadly underperformed over the same period. Compared with past cycles, today’s ratio sits above the extreme lows seen in 1980 (about 1.3) and 2011 (about 6.7), suggesting that the current cycle has not yet reached an extreme compression like prior bull‑market endpoints.
That said, the persistence of inflation and heavy central bank gold purchases argues that the structural forces supporting gold’s relative strength remain in place. For the ratio to mean‑revert back toward the 50‑year average of 15, the Dow would need to substantially outperform gold from here — an outcome that typically requires a meaningful shift in the monetary backdrop, such as lower inflation, reduced central bank demand for bullion, or a sustained dollar rally.
How Investors Use the Dow‑to‑Gold Ratio in Practice
A common practical framework comes from Bill Bonner, who views the ratio through two thresholds: readings above about 15 indicate gold is relatively inexpensive versus stocks and argue for larger gold allocations, while readings below about 5 have historically signaled that equities are deeply undervalued in gold terms and may be time to rotate back into stocks. Investors use the ratio as a long‑term rebalancing guide rather than a short‑term timing tool: it helps determine allocation bias over multi‑year horizons rather than trigger immediate trades.
What Are the Limits of the Dow‑to‑Gold Ratio?
The ratio is a robust long‑term gauge but has limits. It is not a precise timing device: during the long equity advance of the 1980s and 1990s the ratio rose for nearly two decades, and investors who exited stocks when it first crossed a threshold missed substantial gains. The ratio also ignores dividends — stocks pay distributions that gold does not — so comparisons that include dividend reinvestment will differ from the pure ratio. Finally, the Dow represents 30 large U.S. companies, a relatively narrow slice of global markets. The ratio should be one part of a broader valuation and portfolio framework, not the only input.
Your Gold Buying GuideMost investors overpay when they buy gold and again when they sell. This guide explains what to own and why.
People Also Ask
What is the Dow‑to‑gold ratio right now?
As of April 2026 the ratio is approximately 10 — the Dow near 47,917 divided by a gold spot price near $4,780 per ounce. That means roughly ten ounces of gold equate to one unit of the Dow index, a level below the 50‑year average and consistent with an established gold bull market.
How is the Dow‑to‑gold ratio calculated?
Divide the current value of the Dow Jones Industrial Average by the spot price of one ounce of gold. For example, a Dow at 47,000 and gold at $4,700 would yield a ratio of 10 — the number of ounces needed to match one unit of the Dow.
What does a low Dow‑to‑gold ratio mean?
A low ratio indicates gold has gained versus stocks: fewer ounces now equal the same index value. Historically, low readings have aligned with gold bull markets, monetary stress, and periods of sustained inflation. The 1980 trough near 1.3 occurred at the peak of a major gold bull run following a decade of stagflation.
What was the ratio at its highest?
The ratio hit its peak around 43 in 1999 during the dot‑com bubble, when gold traded in the low $200s per ounce. That reflected extreme equity overvaluation relative to hard money.
Is the Dow‑to‑gold ratio a good investment signal?
It is a useful long‑term valuation tool, but not a short‑term trading signal. Historically, readings above roughly 15 have preceded multi‑year gold strength, while readings below about 5 have preceded equity recoveries. Use it to guide strategic allocation and rebalancing rather than to time single trades.
What does the ratio tell us about inflation?
When inflation erodes the dollar’s purchasing power, gold tends to hold or gain value while equities can struggle in real terms. A falling ratio reflects monetary debasement: the same Dow exposure buys fewer ounces of gold than before. The ratio measures wealth in sound money rather than in a depreciating currency.
What ratio level should trigger buying gold?
Under Bill Bonner’s framework, a ratio above about 15 is a signal that gold is undervalued relative to stocks and that investors should consider increasing gold exposure. Readings below roughly 5 have historically signaled the time to rotate back into equities. At around 10 today, the buy‑gold signal has already played out materially; the ratio is tracking toward the eventual rotation zone rather than away from it.
The Bottom Line
The Dow‑to‑gold ratio is one of the clearest long‑run valuation tools available. It does not predict short‑term moves, but it strips away the dollar illusion to compare stocks and gold in real money terms. At roughly 10 today, the ratio sits well below its 50‑year average and far below the 1999 peak of 43, indicating that gold has already repriced equities significantly in this cycle. The structural forces supporting gold — monetary weakening, strong central bank purchases, and above‑trend inflation — are still present, so investors should use the ratio to inform positioning and long‑term allocation decisions rather than as a one‑week timing tool.
SOURCES
1. StatMuse — What Is The Dow To Gold Ratio
2. Yahoo Finance — Dow Jones Industrial Average
3. MacroTrends — Dow to Gold Ratio: 100 Year Historical Chart
4. LongtermTrends — Dow to Gold Ratio: Updated Chart
5. CBS News — What Is the Highest Gold Price in History?
6. Trading Economics — Gold Price Data
7. J.P. Morgan Global Research — Gold Price Predictions 2026
8. Bonner Private Research — Golden Flak Jacket
This article is for informational purposes only and does not constitute financial advice. Past performance is not indicative of future results. Always consult a qualified financial advisor before making investment decisions.
You May Also Like
- How to Read the Gold‑Silver Ratio — And What to Do About It
- Is a Policy Reversal Coming? What the Conflict Pressure Index Means for Gold
- Gold ETFs Are Booming. But Do You Actually Own Gold?
- Silver Demand by Sector: Industry, Jewelry & Investment
- Small Market, Big Swings: Why Silver Is More Volatile Than Gold
- 87% Dollar Devaluation Since 1971: Why Central Banks Keep Buying Gold
- How to Roll Over Your 401(k) Into a Gold IRA
Popular Topics
Picked from the archive
-
01
 Topics
Why Metals Led Markets in 2025 and What It Means for 2026
-
02
Topics
Wall Street Whiplash: Stocks Rally on CPI, Plunge on PPI Shock
-
03
Topics
US Treasury Yields Rise Ahead of Major Bond Auction
-
04
Topics
Markets Slash ECB Rate-Cut Odds After Trade Deal Eases Tariff Fears
-
05
Topics
3 Questions Investors Must Ask Before Buying Any Asset in 2026
-
06
Topics
Gold vs Cash: How Inflation Destroys Dollar Purchasing Power
-
07
Topics
U.S. Gas Prices Fall to 12-Month Low Despite Heat; Storage Up 6%
-
08
Topics
Gold Price 3,767 USD: Fed Rift Deepens as China Eyes Share