Silver Price Near $80 as Iran Ceasefire Revives Rate-Cut Hopes

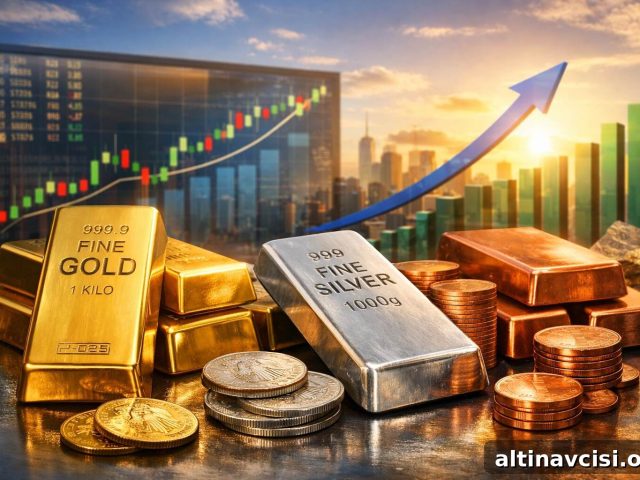
Silver jumped more than 5% on Tuesday, pushing toward $80 per ounce for the first time since March, and it held those gains into Wednesday. Optimism about peace talks has rippled through oil, the dollar, and expectations for Federal Reserve rate cuts — and all three factors are highly relevant for precious metals.
The price move looks straightforward at first glance, but the mechanics behind it are more complex. Understanding that mechanism helps explain how future headlines may affect the market.
Why did the Iran war hurt gold and silver prices?
When the US and Israel launched an air campaign against Iran on February 28, many investors expected a rush into gold as a safe haven. Instead, gold fell roughly 10% from its pre-war levels. The key reason was energy markets — specifically oil.
Iran’s closure of the Strait of Hormuz, through which roughly 20% of global oil passes, sent crude above $100 a barrel. Higher oil raised inflation expectations, which reduced the likelihood of near-term Fed rate cuts. As rate-cut odds collapsed, Treasury yields became relatively more attractive. That dynamic is unfavorable for non-yielding assets like gold and silver.
In short, the conflict produced an inflation shock rather than safe-haven demand, and that trapped precious metals for a time. On the CME FedWatch tool, odds of a Fed rate cut fell sharply during the peak of the conflict (CME FedWatch, April 2026).
Silver faced pressure on two fronts. As a monetary metal it was impacted by the same rising-rate dynamics that weighed on gold. At the same time, silver’s role as an industrial metal — used in solar panels, electric vehicles, and grid infrastructure — meant demand was hit by manufacturing and supply disruptions tied to the conflict.
The Edge Every Investor Needs
Smarter precious metals investing starts here. The Nuggets Newsletter delivers timely market analysis, Fed updates, global trends, and practical education for investors.
Subscribe to receive concise market updates and alerts about gold and silver prices.
Why are Iran peace talks bullish for silver and gold?
The US–Iran ceasefire announced on April 8, brokered by Pakistan, immediately began to reverse the inflation-driven dynamic. Treasury yields fell about four basis points on the news and markets rapidly repriced rate-cut odds. Within hours, rate-cut expectations rose and gold climbed more than 3% that day.
The situation remains fragile: talks in Islamabad on April 11–12 fell apart, the US naval blockade of Iranian ports remains in place, and the temporary truce is set to expire on April 21. Still, the White House confirmed a second round of negotiations is being actively planned, which markets have already started to price in.
Front-running that possibility, oil has fallen back below $90 and the dollar index slid to a six-week low near 97.96 as the war risk premium unwound. For silver, a potential peace path affects prices through two distinct channels.
First, the monetary channel: lower oil eases inflation expectations and reopens the Fed’s path to rate cuts. Market pricing now shows roughly a 30% chance of a 2026 cut — nearly double the probability from just days earlier (CME FedWatch, April 2026). Policy officials themselves differ: Chicago Fed President Austan Goolsbee has said he might keep rates elevated if oil remains high, while other advisors have argued the opposite.
Second, the industrial channel: silver’s demand from solar panel production, EV batteries, and grid upgrades was constrained by the conflict. A sustained ceasefire would reduce those disruptions and allow industrial demand to recover.
How much has silver gained compared to gold?
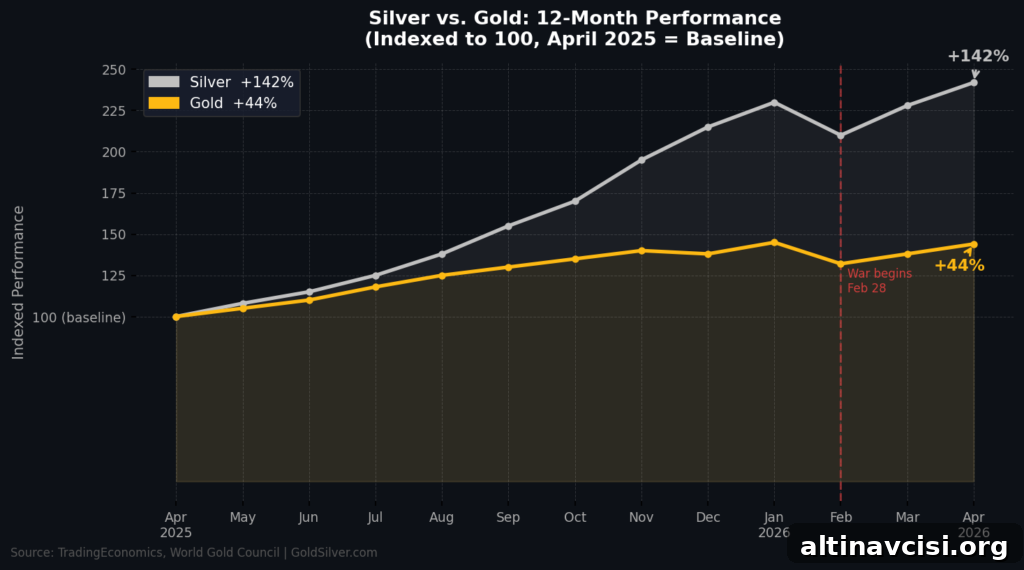
Over the past 12 months silver has risen about 142% while gold has gained roughly 101% (TradingEconomics, April 2026). Both gains are historically large; silver’s performance is particularly pronounced and has driven a tightening in the gold/silver ratio.
The gold/silver ratio — how many ounces of silver buy one ounce of gold — sits near 60:1 as silver outpaces gold. When that ratio tightens, it often signals a phase of the metals bull market in which silver outperforms most.
At roughly $80.50 per ounce for silver, investors can acquire far more ounces for the same capital than when buying gold. For example, a $5,000 allocation buys about 62 ounces of silver or a single ounce of gold at the prices cited — a meaningful difference in exposure per dollar invested.
Is the long-term case for gold and silver still intact?
The Iran conflict created loud short-term noise, but it did not change the underlying long-term case for precious metals. That case is largely monetary and structural rather than purely geopolitical.
Central bank accumulation continues: the People’s Bank of China has added gold to its reserves for 17 consecutive months, taking total holdings to about 2,313 tonnes — roughly 11% of China’s foreign-exchange reserves at current spot prices (World Gold Council, April 2026). Chinese gold ETFs recorded strong inflows in Q1 2026, adding the equivalent of approximately 50 tonnes, the largest quarter on record for that metric (World Gold Council, April 2026).
At the same time, the US fiscal deficit remains large and the Fed’s willingness to hold rates reflects a mix of economic and political considerations. Those structural forces — central bank demand, fiscal expansion, and the long-term erosion of fiat purchasing power — support the case for gold and silver over time.
What should precious metals investors watch next?
April 21 is the near-term date to watch. A confirmed deal or even an extension of the truce would likely push oil lower, weaken the dollar, and lift rate-cut odds — three tailwinds for silver and gold.
If negotiations break down before that date, some recent gains could be reversed. However, the structural bid for precious metals — driven by central bank buying, fiscal expansion, and monetary pressures — does not evaporate with a single headline.
Silver’s 142% gain over twelve months shows it absorbed conflict-related disruptions without breaking the trend. If the ceasefire holds beyond April 21, the combination of lower oil, a softer dollar, and higher rate-cut odds would point in the same bullish direction for silver.
Draw your own conclusion.
Stay On Top of Gold & Silver Prices
Get important market alerts sent straight to your inbox.
Enter your email on the site to receive price alerts and analysis.
SOURCES
1. TradingEconomics — Silver Price
2. TradingEconomics — Gold Price
3. CME Group — FedWatch Tool
4. World Gold Council — China Gold Market Update: A Seasonal Demand Rebound in March
By the GoldSilver Editorial Team — helping investors understand sound money since 2005. This article is for informational purposes only and does not constitute financial, investment, or tax advice. Always consult a qualified financial advisor before making investment decisions.
You May Also Like
- The Fed Goes Silent in 3 Days – What Does That Mean For Gold?
- Gold Is Down 10% From Its War-Peak — and Still Up 46% in a Year
- Gold Outranks the Dollar at Central Banks — What It Means for Your Savings
- Hormuz Blockade Sent Gold Down 2%. Here’s Why That’s Bullish
- Gold Jumps 2% as Trump Plans Iran War Address Tonight
- $88 Billion a Month: Why U.S. Debt Is Driving Gold Prices
- CPI Hits 3.3%, GDP Stalls — Is Stagflation 2026 Here?
Popular Topics
Picked from the archive
-
01
 Topics
Why Metals Led Markets in 2025 and What It Means for 2026
-
02
Topics
Wall Street Whiplash: Stocks Rally on CPI, Plunge on PPI Shock
-
03
Topics
US Treasury Yields Rise Ahead of Major Bond Auction
-
04
Topics
Markets Slash ECB Rate-Cut Odds After Trade Deal Eases Tariff Fears
-
05
Topics
3 Questions Investors Must Ask Before Buying Any Asset in 2026
-
06
Topics
Gold vs Cash: How Inflation Destroys Dollar Purchasing Power
-
07
Topics
U.S. Gas Prices Fall to 12-Month Low Despite Heat; Storage Up 6%
-
08
Topics
Gold Price 3,767 USD: Fed Rift Deepens as China Eyes Share