How the Recent Gold Correction Affected Investors’ Portfolios
Last verified October 2026.
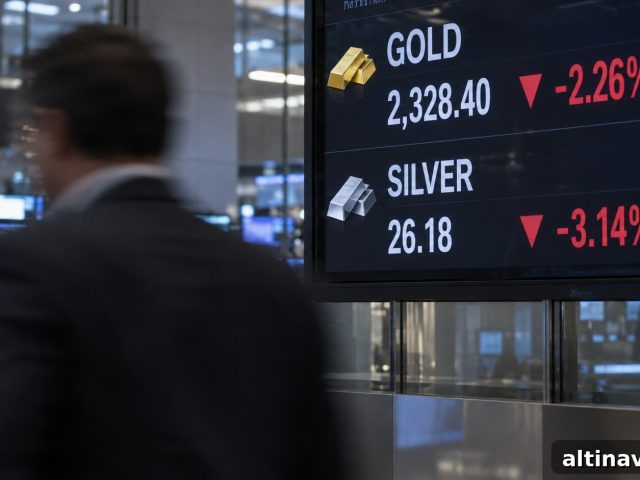
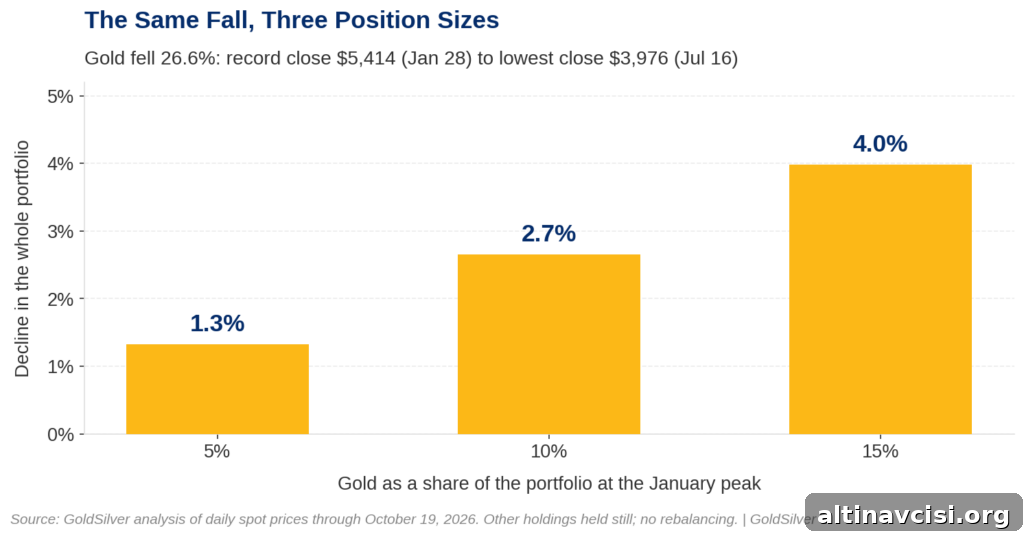
The 2026 gold correction drove prices down as much as 26.6% from the record closing high. That decline shows how position size, not central bank messaging, determines how much a fall in gold affects an overall portfolio. For example, if gold represented 10% of a portfolio at the January peak, a 26.6% drop in gold would reduce the total portfolio value by roughly 2.7%, assuming other holdings held steady.
On Monday, October 19, 2026, gold traded in the mid-$4,100s, about 23% below its record closing level.
Key takeaways:
- The gold correction reached a $3,976 close on July 16, 2026, a 26.6% decline from the January record close. For a portfolio that was 10% allocated to gold at that peak, the drop translated into about a 2.7% hit to the overall portfolio, all else equal.
- The same math produces a 1.3% impact at a 5% allocation and 4.0% at a 15% allocation. Silver fell more sharply—about 52.4% at its low—so a smaller weight in silver can produce a similar overall effect.
- Federal Reserve Chair Kevin Warsh declined on October 16, 2026 to preview the Fed’s next policy decision. For investors, position size is the decision made before headlines arrive, and it can be reviewed afterward.
What Did the Fed Chair Say on October 16?
At an IMF event in Bangkok on October 16, 2026, Federal Reserve Chair Kevin Warsh declined to preview the outcome of the Fed’s upcoming October 27–28 meeting. “I don’t prejudge meetings,” he said, according to reporting from the Associated Press. Most Fed officials, the AP noted, expected another rate increase before year-end. The Federal Reserve raised its target rate range to 3.75%–4.00% in its September statement. Separately, the U.S. Bureau of Labor Statistics reported September consumer price inflation at 3.7% year-over-year.

The Edge Every Investor Needs
Smarter precious metals investing starts here. The Nuggets Newsletter delivers market insights, Fed updates, global trends, and educational content.
How Does Position Size Turn a 26.6% Gold Correction Into a 2.7% Event?
Using daily spot data, gold’s record closing high was $5,414.49 on January 28, 2026. Its lowest closing price since then was $3,976.14 on July 16, 2026—a decline of 26.6%. If gold constituted 10% of a portfolio at the peak, that 10% piece would lose 26.6% of its own value. Ten percent of a 26.6% decline equals a 2.66% reduction to the total portfolio. On a $100,000 portfolio, a $10,000 gold holding would have fallen by about $2,660.
| Gold weight at the January peak | Portfolio hit at the July low | Portfolio hit at today’s price |
|---|---|---|
| 5% | 1.3% | 1.2% |
| 10% | 2.7% | 2.3% |
| 15% | 4.0% | 3.5% |
This calculation intentionally holds other assets constant to isolate the effect of gold alone. Real portfolios change over time—owners may trim or add holdings—so actual outcomes vary. These weights illustrate simple arithmetic rather than prescribe a single correct allocation. Deciding how much gold to hold depends on individual objectives, time horizon, and other assets.
Because silver fell around 52.4% at its low, even a 5% allocation to silver would have cost roughly 2.6% of a portfolio—similar to the damage a 10% gold weight produced in this correction.
What Does the Gold Correction Arithmetic Leave Out?
This arithmetic does not judge whether owning gold at the peak was the right decision. It simply measures the mechanical effect of a price change on portfolio value. An investor who bought at the top still holds gold that is 26.6% cheaper at the low.
Different data sources report slightly different intraday benchmarks. For example, LBMA’s Precious Metals Market Report listed a benchmark auction price of $5,501.70 on January 29, 2026; that represents a single morning auction rather than a daily close. Other historical stretches show deeper, longer losses: from September 2011 to December 2015, gold fell about 44.6% in closing price, and after the 1980 peak gold experienced declines approaching 70% over nearly two decades. Conversely, gold can also rally strongly—one five-year span shows a rise of roughly 136%—so long-term performance varies over different horizons.
Sizing a position does not avoid declines, but it helps make them survivable without forcing a rapid, emotionally driven reaction.
Why Does a Sized Position Fit the Sound Money Case?
With inflation around 3.7%, assets that earn less than that rate lose purchasing power over time. Physical gold is not a promise to pay and sits outside the fiat monetary system, which makes it attractive to investors seeking a store of value. The structural rationale for holding gold plays out over years; during those years, prices can fall in multi-month corrections like the 2026 episode. Choosing a deliberate allocation is how an owner accepts those temporary drawdowns as part of a longer-term plan.
What Does a Fed Chair Who Won’t Forecast Mean for an Owner?
A Fed chair who refuses to preview policy decisions leaves markets filling in rate-odds tables, which focus on the next meeting. Those odds speak to short-term pricing but not to an investor’s ability to withstand price swings. For an owner whose allocation is sized so a 26.6% drop equals a 2.7% portfolio event, the outcome of a single meeting is less consequential: the key decision—how much to allocate—was already made.
The Federal Reserve scheduled its next decision for October 28, 2026. After a roughly 23% fall by mid-October, a 10% gold allocation at the January peak would now be closer to an 8% share of the portfolio, again assuming other assets remained unchanged. Restoring a prior allocation is a deliberate choice; so is doing nothing.
Stay On Top of Gold & Silver Prices
Get important market alerts sent straight to your inbox.
SOURCES
1. Associated Press coverage of Kevin Warsh’s remarks – October 16, 2026.
2. Federal Reserve FOMC statement – September 16, 2026.
3. U.S. Bureau of Labor Statistics CPI release – October 14, 2026.
4. Daily gold and silver spot prices (data through October 19, 2026).
5. LBMA Precious Metals Market Report: Q2 2026 – July 15, 2026.
6. Historical gold price summaries and long-term performance data.
7. Federal Reserve FOMC meeting calendar – October 2026.
Disclaimer: This article is for informational purposes only and does not constitute investment advice. Past performance does not guarantee future results. Consult a qualified financial advisor before making investment decisions.
You May Also Like:
- Central Bank Gold Buying: Why 39 Tonnes Matters
- Investors Turn to Treasuries as AI Stocks Slide
- London Gold Vault Holdings Rose 3.78% in Q3. What Changed?
- Gold Rebounds Above $4,130: What Changed for Owners?
- How 3.7% Inflation Impacts Wealth Preservation
Popular Topics
Picked from the archive
-
01
 Topics
Store Gold at Home Securely: Safes, Security and Insurance
-
02
Topics
Xi Arrives in Washington as Gold and Silver Tumble
-
03
Topics
Gold Near $4,330 as 70% Rate-Hike Odds Rise, China Intervenes
-
04
Topics
Five Major Institutions Issue Identical Warning on Gold Selloff
-
05
Topics
Silver vs Gold 2026-2031: 5-Year Investment Outlook
-
06
Topics
October Gold and Silver Selloff: Impact for Long-Term Holders
-
07
Topics
Federal Reserve Votes Wednesday: Track the Vote Tally
-
08
Topics
COMEX Silver First Notice Day: Key Events to Watch April 30