October Gold and Silver Selloff: Impact for Long-Term Holders
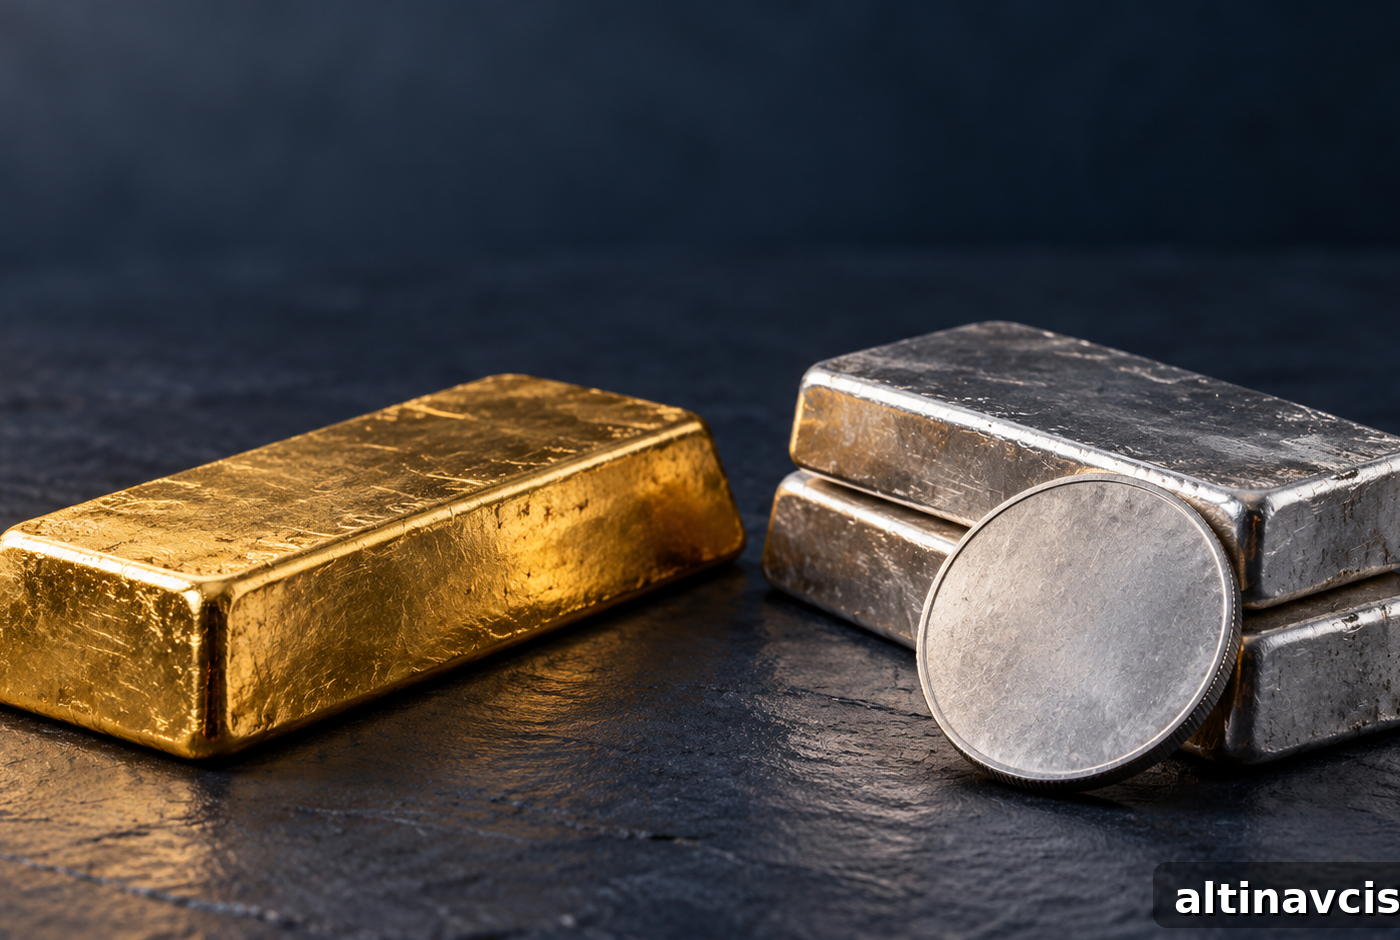
October’s sell-off followed a familiar pattern: silver fell more sharply than gold. Silver generally posts larger percentage swings in both directions, amplifying gains in rallies and losses in declines. At a snapshot taken on October 30, 2026, at 16:45 UTC, gold was down about 6.3% from its September 30 close, while silver had declined roughly 18.6%. Both metals had traded slightly higher earlier in the month.
The month featured a widening performance gap between the two metals, mixed signs on physical demand and a Federal Reserve that opted to hold rates. For long-term physical owners, those developments are best considered together rather than in isolation.
This summary covers October to date. The October 30 snapshot is an intraday observation, not a final month‑end close.
How did gold and silver perform during October?
Using the same spot-price feed for both metals, the month-to-date comparison was:
October 2026 · Month to date
Gold and silver performance
Snapshot: October 30, 2026, at 16:45 UTC
Swipe or scroll horizontally to view all columns.
| Metal | September 30 daily close |
October 30, 16:45 UTC snapshot |
October-to-date change |
|---|---|---|---|
| Gold | $4,157.14 | $3,895.41 | −6.3% |
| Silver | $60.42 | $49.18 | −18.6% |
Prices shown are USD per troy ounce from the platform’s market-data feed. Values are rounded for display; percentage changes are calculated from unrounded observations. The baseline is the provider’s September 30 UTC daily close; the endpoint is an intraday snapshot recorded on October 30.
The path of prices matters. On October 9, gold was about 0.9% above its September close and silver was up roughly 0.7%. By October 29, daily closes showed losses of approximately 3.3% for gold and 13.6% for silver. The October 30 snapshot captured additional weakness that extended those declines.
That sequence makes October a month-long decline rather than an isolated end-of-month move; losses accumulated over several weeks before the most recent session.

The Edge Every Investor Needs
Smarter precious‑metals investing starts here. The Nuggets newsletter delivers timely market insights, Fed updates, trend analysis and educational content to help informed long‑term decisions.
Which developments defined the month?
Three dated events help explain the backdrop for October’s price action:
October 20 — Mixed physical demand for gold. The World Gold Council’s update on India noted stronger seasonal and wedding demand in mid‑October and smaller local discounts, yet trade reports indicated bar‑and‑coin buying had softened. That mid‑month data does not, however, capture demand conditions that followed the later price decline.
October 28 — The Fed held rates. The Federal Reserve left its target range unchanged at 3.75%–4.00%. Two officials dissented, preferring another 25‑basis‑point increase, signaling that tighter policy remained a possibility even as the committee paused.
October 29 — Growth and inflation data in focus. The Bureau of Economic Analysis’s advance estimate put third‑quarter real GDP growth at an annualized 3.4%. Its personal‑income and outlays report showed PCE prices rising 0.5% month‑over‑month in September and 3.6% year‑over‑year. These releases, published in October, highlighted an economy still generating growth and inflation pressures.
For non‑yielding assets like gold and silver, interest‑bearing alternatives matter. The opportunity cost of holding bullion rises when bonds and cash yields are attractive. Still, these data points alone cannot definitively apportion how much of October’s decline each factor caused.
What was different about silver’s experience?
Silver underperformed gold early in the month. By the October 16 close, gold was only about 0.2% above its September 30 level, while silver had already fallen roughly 5.7%. By the October 30 snapshot, silver’s percentage loss was nearly three times that of gold.
Silver’s dual role — as an industrial commodity and a monetary metal — exposes it to demand drivers that differ from gold’s. Manufacturing and industrial expectations can influence silver’s price alongside investment flows. However, price movements alone do not identify which holder types sold or prove that industrial demand was the primary cause of the decline.
October’s behavior shows that gold and silver can produce very different outcomes within the same precious‑metals allocation.
What does October mean for long-term physical owners?
First, volatility is a normal part of long‑term physical ownership and can create opportunities to adjust an allocation. Pullbacks may present attractive entry points to add metal, while rallies can be a prompt to rebalance toward target allocations. Recovery horizons differ, so decisions should align with personal goals and investment timelines. Directly holding bullion also changes custody and issuer exposure; premiums on purchase, storage costs and resale spreads all factor into the economics of ownership.
Second, inflation by itself does not guarantee rising metal prices. October combined persistent inflation readings, a Fed pause and falling bullion prices — a mix that shows these inputs can move in differing directions and should be weighed together when positioning metals against cash and bonds.
Third, demand signals are date‑ and region‑specific. Stronger seasonal jewelry demand in India can coexist with weaker investment flows elsewhere; neither observation alone establishes a global price floor.
For buyers who delayed purchases at higher prices, October’s pullback may offer a more attractive entry point. Physical gold and silver remain viable components of a long‑term, buy‑and‑hold allocation. A single month of weakness does not invalidate that approach but can change the price at which new owners begin.
Providers that sell and store bullion make it easier to establish custody and track holdings. If you plan to hold metal long term, consider how storage, insurance and account features align with your objectives before buying.
Stay On Top of Gold & Silver Prices
Receive concise market alerts and price updates by email.
SOURCES
1. GoldSilver — Gold Price Chart
2. GoldSilver — Silver Price Chart
3. World Gold Council — India Gold Market Update: Seasonal Demand Shows Early Strength
4. Federal Reserve — FOMC statement, October 28, 2026
5. Bureau of Economic Analysis — GDP advance estimate, 3rd quarter 2026
6. Bureau of Economic Analysis — Personal Income and Outlays, September 2026
Disclaimer: This article is informational and does not constitute investment advice. Past performance does not predict future results. Consult a qualified financial advisor before making investment decisions.
You May Also Like:
- Silver Price Below $50: Why It’s Falling Faster Than Gold
- China Gold Imports via Hong Kong: Up Over 28%, Demand Mixed
- World Bank Precious Metals Outlook: 2027 Forecast
- Silver Tests Its 2026 Low Again
- Gold Price Today: Does It Rise or Fall in an AI Stock Selloff?
- Durable Goods Beat: What It Means for Gold
- Gold Steadies Near $4,000 as Fed Week Begins
- Russia Is Selling Gold: Why That’s Not Necessarily Bearish
- Gold‑Silver Ratio Today: Why Silver Is Falling Faster
- Gold Priced in Oil: What an Ounce Buys Now vs. a Year Ago
Popular Topics
Picked from the archive
-
01
 Topics
Gold Surges Past $4,130: What It Means for Investors
-
02
Topics
Why Gold Rallyed Despite Lower Jobless Claims: 4 Key Signals
-
03
Topics
U.S. Sanctions Target Iran’s Gold Sector, Prices Slide
-
04
Topics
Fed Printed 7 Trillion: Why Money Velocity Is Rising
-
05
Topics
Gold Market Split: Short-Term Sellers vs Long-Term Buyers
-
06
Topics
Gold Drops 19%: $3.8B Investor Bet Says It Won’t Matter
-
07
Topics
300 Billion Lesson: What Frozen Reserves Revealed About Gold
-
08
Topics
Which Gold Coins and Bars Are IRA Eligible